Collectd: FAQ
To learn how to set up collectd with Librato check out the Librato Server Monitoring with collectd article. Here are some of the most common questions that come up:
What versions of collectd are supported?
The native collectd integration supports versions >= 4.10.0 at the moment .
How can I install collectd on Amazon Linux?
A few changes are needed from the Debian-based instructions found when adding a new collectd integration under your Account Settings.
$ sudo vi /etc/yum.repos.d/epel.repo
Under the section marked [epel], change enabled=0 to enabled=1 and save:
$ sudo yum update
$ sudo yum -y install collectd
$ sudo vi /etc/collectd.conf
Apply the same edits to the above file as you found in the Debian-based instructions:
$ sudo /etc/init.d/collectd start
How can I install collectd on RHEL/CentOS 6?
A few changes are needed from the Debian-based instructions found when adding a new collectd integration under your Account Settings.
$ wget http://download.fedoraproject.org/pub/epel/6/i386/epel-release-6-8.noarch.rpm # for 32-bit
$ wget http://download.fedoraproject.org/pub/epel/6/x86_64/epel-release-6-8.noarch.rpm # for 64-bit
$ sudo rpm -ivh epel-release-6-8.noarch.rpm
$ sudo yum clean all
$ sudo yum update
$ sudo yum -y install collectd
$ sudo vi /etc/collectd.conf
Apply the same edits to the above file as you found in the Debian-based instructions, then restart:
$ sudo /etc/init.d/collectd restart
Is it possible to set up the source name for the collectd config?
Yes. By default, collectd will use the hostname as the source and that will be registered as the source by Librato. To customize:
- Open /etc/collectd/collectd.conf (or /etc/collectd.conf for CentOS/RHEL).
- Uncomment the HostName line near the top.
- Place your desired hostname in quotes i.e.
HostName "my-host". - Save the file and restart collectd:
On Ubuntu:
sudo service collectd restart
On CentOS/RHEL:
sudo /etc/init.d/collectd restart
Can I change the reporting interval?
You can change the reporting interval in the collectd conf file using
the Interval parameter. Keep in mind that you should update the
Period attribute for all the collectd metrics in Librato. At Librato
we typically use a reporting interval of 60s so our collectd.conf looks
like this:
#----------------------------------------------------------------------------#
# Interval at which to query values. This may be overwritten on a per-plugin #
# base by using the 'Interval' option of the LoadPlugin block:               #
#   <LoadPlugin foo>                                                         #
#       Interval 60                                                          #
#   </LoadPlugin>                                                            #
#----------------------------------------------------------------------------#
Interval     60
How can I reduce the number of metrics / aggregate CPU metrics coming from collectd?
You can aggregate all CPU metrics using the Aggregation plugin in collectd 5.2 and later. This will aggregate the CPU statistics of all CPUs into one set using the sum and average consolidation functions:
LoadPlugin aggregation

<Plugin "aggregation">
  <Aggregation>
    Plugin "cpu"
    Type "cpu"

    GroupBy "Host"
    GroupBy "TypeInstance"

    CalculateSum true
    CalculateAverage true
  </Aggregation>
</Plugin>
Then install and use the Match:RegEx plugin to eliminate the per-core metrics:
LoadPlugin "match_regex" # we want to use this for our Matching
<Chain "PostCache">
  <Rule> # Send "cpu" values to the aggregation plugin.
    <Match regex>
      Plugin "^cpu$"
      PluginInstance "^[0-9]+$"
    </Match>
    <Target write>
      Plugin "aggregation"
    </Target>
    Target stop
  </Rule>
  Target "write"
</Chain>
These aggregated metrics will arrive in the new format
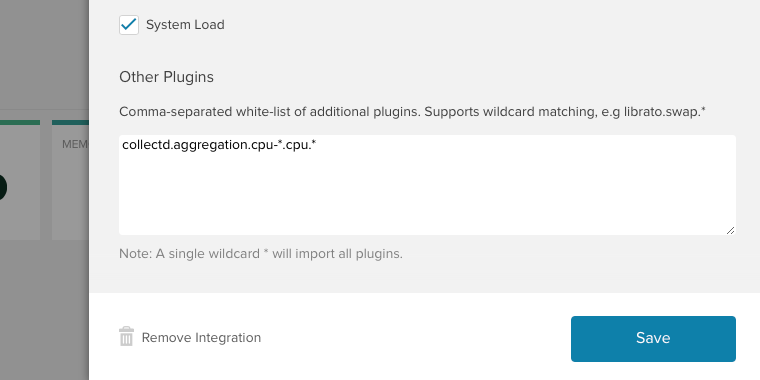
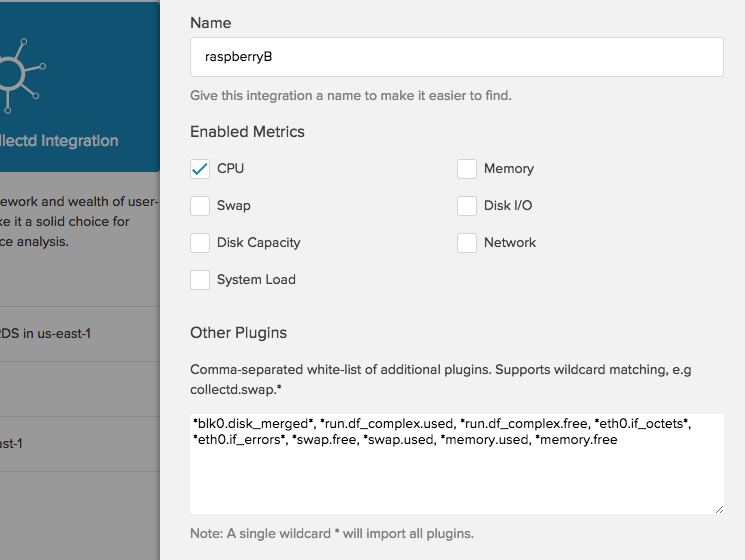
collectd.aggregation.cpu-average.cpu.wait so you’ll need to add a
whitelist for them in the Other Plugins field. A good wildcard
would be collectd.aggregation.cpu-*.cpu.*. Make sure to click
Update to save your changes.

Finally, change the composite function of the CPU graph on your collectd dashboard to take this change into account. IMPORTANT NOTE: Since the default Librato “Collectd” dashboard is read-only, you will need to clone it first in order to edit it. Learn how to clone a Space here.
from:
divide([
    sum(derive(series("collectd.cpu.*.cpu.idle", "%"))),
    sum(derive(series("collectd.cpu.*.cpu.*", "%")))] )
to:
divide([
   sum(derive(series("collectd.aggregation.cpu-average.cpu.idle", "%"))),
   sum(derive(series("collectd.aggregation.cpu-average.cpu.*", "%")))] )
Why are metrics that I’ve disabled still being accepted?
Our filters only take effect if you’re using the token generated for
that specific integration. If you change your collectd configuration
to use a different (active) token, the measurements will bypass the
intended collectd filters. This is easily remedied by copying the
token string found in view config instructions into
your collectd.conf and restarting the collectd service
on your host(s).
How can I send “disk-free” percentage metrics instead of 1K blocks?
Enabling ValuesPercentage ** in your **df plugin block will instruct collectd to begin reporting metrics in “percent bytes”:
- percent_bytes-free
- percent_bytes-reserved
- percent_bytes-used
Your plugin block may look something like the following. If you no
longer wish to collect the df_complex metrics you’ll need to
set ValuesAbsolute to false. You will need to
restart collectd after saving your changes.
<Plugin df>
  ValuesAbsolute true
  ValuesPercentage true
</Plugin>
How much does it cost to monitor a server?
The cost of your server monitoring setup depends on the number of metrics you are monitoring. Thanks to Service Side Filtering you have fine grained control over the cost. Here are some examples:
Basic configuration, single core: $2.00/server/mo (8 cpu metrics, 4 interface metrics, 2 memory metrics, 2 swap metrics, 4 disk metrics, all at 60 second resolution)

Basic configuration, eight cores: $7.60/server/mo (Same metrics as above measured at 60s resolution, but each cpu core is tracked individually (8 metrics per core). If you use collectd >5.2 and install the aggregation and match_regex plugins you can reduce the number of cpu core metrics to 8, no matter how many cores you have)
More detailed configuration, eight cores: $7.25/server/mo (8 cpu metrics (using collectd >5.2 and the aggregation + match_regex plugins), 3 load metrics, 4 memory metrics, 5 swap metrics, 5 disk metrics, 4 interface metrics, all at 10 second resolution)
This is subject to change based on collectd default input plugins and pricing changes so please reference your exact metric count along with up-to-date pricing plans to confirm amounts.
You can find an estimate of your monthly bill on your Account Settings page.
I am getting connection errors while SELinux is enabled. How do I fix this?
SELinux policy is customizable based on least access required. Collectd policy is extremely flexible and has several booleans that allow you to manipulate the policy and run collectd with the tightest access possible.
If you’re seeing errors similar to the following:
Sep  4 17:00:50 collectd[27602]: write_http plugin: curl_easy_perform failed
with status 7: Failed to connect to 184.xx.xxx.xxx: Permission denied
Sep  4 17:00:50 collectd[27602]: Filter subsystem: Built-in target `write':
Dispatching value to all write plugins failed with status -1.
Sep  4 17:00:50 collectd[27602]: Filter subsystem: Built-in target `write':
Some write plugin is back to normal operation. `write' succeeded.
You’ll probably want to determine whether collectd can connect to the network
using TCP by turning on the collectd_tcp_network_connect boolean which is
disabled by default.
Try running the following command (as root):
$ setsebool -P collectd_tcp_network_connect 1

