Heroku Logdrain
Heroku native metrics, such as router, postgres, and per-dyno can be sent to a log drain hosted by Librato. This solution is ideal for users who want to aggregate metrics from multiple Heroku applications into one Librato account.
NOTE: You must be logged into a direct Librato account in order for this integration to work properly (does not support Heroku Add-On accounts). Sign up for a Librato account here.
Installation
To begin, navigate to the Integrations page:

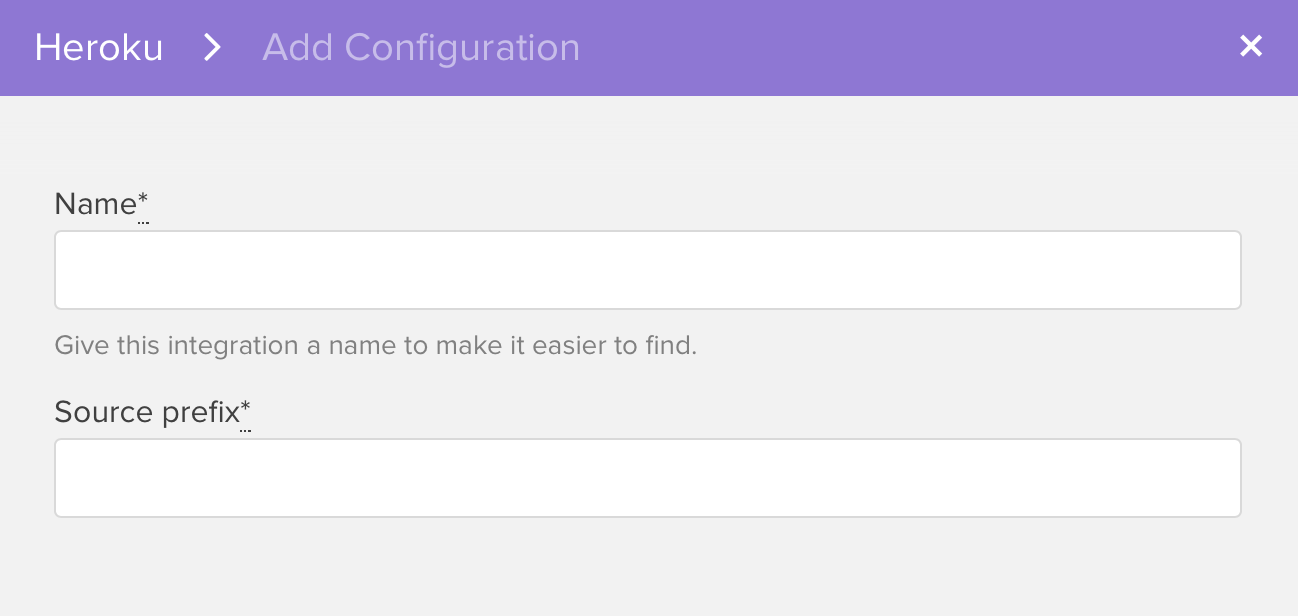
To create a new integration, click on the Heroku icon and then the “Add Configuration” button:

Give the integration a unique name. Optionally, you can also set the source prefix.

We recommend naming the source prefix after your application and/or environment, e.g., librato-marketing-stg. For more information, check out our documentation on sources.
After saving, you will be presented with a log drain URL:

Click on the clipboard to copy the shell command:

Next, navigate to your terminal and cd to the directory of your app. Run the previous copied command.
Finally, run heroku restart to restart your dynos and begin draining
metrics into Librato. Optionally, run heroku labs:enable
log-runtime-metrics to enable per-dyno runtime metrics.
Preconfigured Spaces
To verify the configuration, navigate to the Spaces menu for access to preconfigured Spaces for the newly created Heroku integration. We create a number of different Spaces:
- Heroku Error Metrics
- Heroku HTTP Status Codes
- Heroku Overview
- Heroku Postgres
- Heroku Runtime Metrics
- Heroku Runtime Metrics (Dynamic Source)
The Heroku Overview Space includes a Big Number chart that shows you the App Availability in percent and changes color based on pre-set thresholds.


