JVM

The Java Virtual Machine (JVM) compiles and runs Java applications. The JVM includes built-in instrumentation that can be monitored using Java Management Extensions (JMX) technology.
Librato provides an out-of-the-box monitoring solution for the JVM. The Librato Agent allows you to easily monitor JVM health and performance. We use the collectd GenericJMX plugin to gather Managed Beans (MBeans) metrics from an MBeanServer using JMX.
Create the Integration
The JVM integration depends on the Librato Agent. If you haven’t already, you will first need to install the Librato Agent. Once this is complete, select the JVM icon in the integrations catalogue.

Toggle the Enabled switch to activate the JVM integration on your Librato account and create the preconfigured JVM spaces.

At this point, any JVM metrics associated with this integration will be allowed through your Librato Agent service-side filters.
Plugin Configuration
Librato Agent provides a default /opt/collectd/etc/collectd.conf.d/jvm.conf
configuration file, which must be edited to suit your environment.
LoadPlugin java

Include "/opt/collectd/share/collectd/jvm_default.conf"

<Plugin "java">
  <Plugin "GenericJMX">
    <Connection>
      ServiceURL "service:jmx:rmi:///jndi/rmi://localhost:17264/jmxrmi"
      Collect "memory_heap"
      Collect "memory_nonheap"
      Collect "classes"
      Collect "threads"
      Collect "compilation"
      Collect "garbage_collector"
      Collect "memory_pool"
    </Connection>
  </Plugin>
</Plugin>
The configuration of the GenericJMX plugin consists of a Connection block which specifies how to connect to an MBeanServer and what data to retrieve. ServiceURL specifies the MBeanServer to query and the multiple Collect blocks specify which of the MBean blocks to gather with this connection.
For a seamless integration, we’ve mapped and included a set of default metrics available at /opt/collectd/share/collectd/jvm_default.conf.
Please see the official collectd GenericJMX plugin documentation for more configuration details.
Note: You must restart the agent after any changes to your Librato Agent configuration files.
$ sudo service collectd restart
At this point you should begin seeing librato.jvm.* metrics in your Librato account.
JVM Workspace
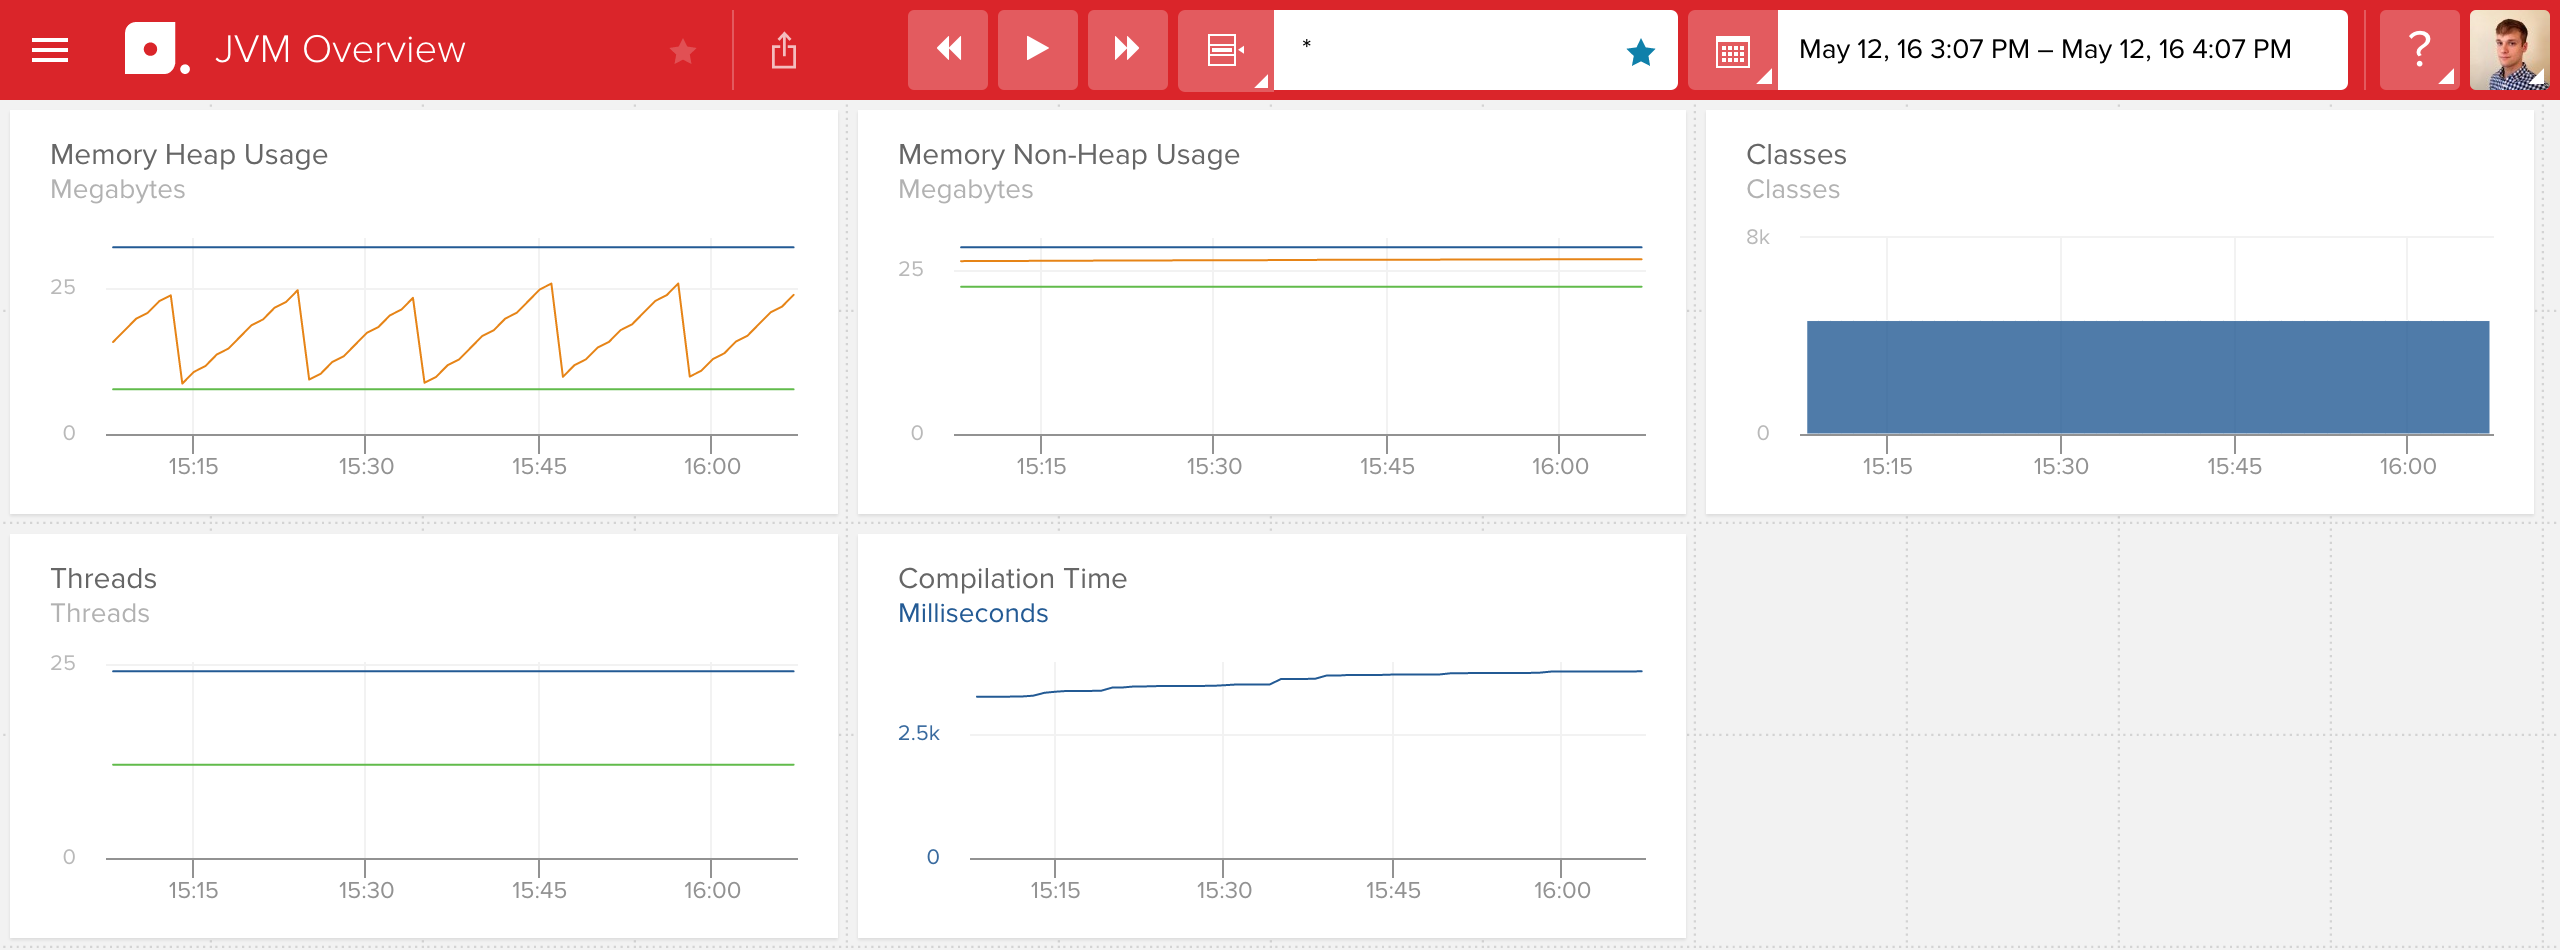
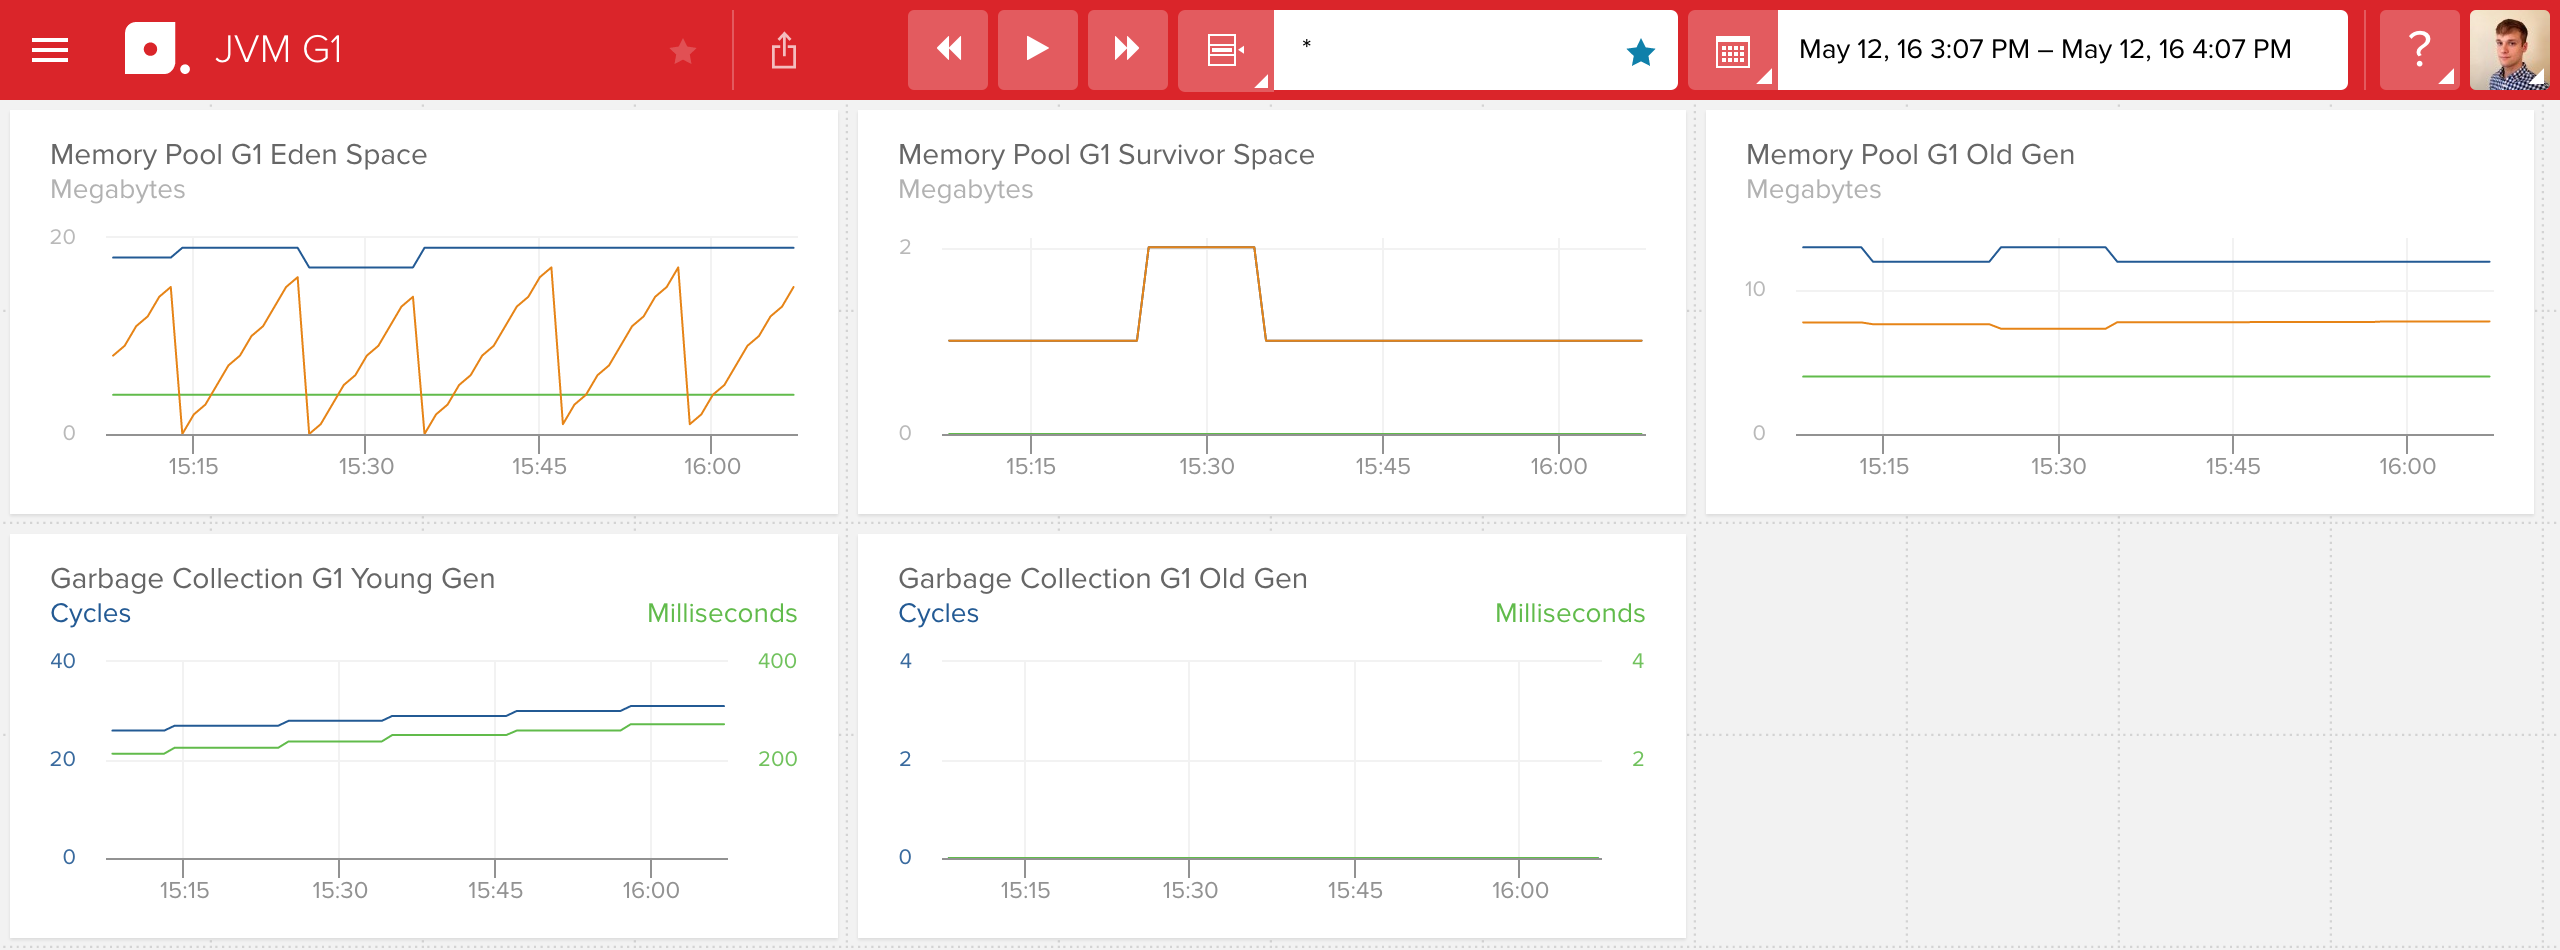
Visit your JVM preconfigured spaces to observe your new metrics as they stream in.


Use our dynamic source field at the top to filter your view to a specific JVM
instance or subset of metric sources. For example, to isolate the view to the
JVM instance associated with the name production, use a dynamic source
value of *.production.
FAQ
For specific answers to Librato Agent questions check out our Librato Agent FAQ.
Let us know what you think when you take this for a spin. We would love to incorporate your feedback and any new dashboards you design into the ongoing development of this key server monitoring technology.
Troubleshooting
JVM users may encounter the following error when trying to load the Java plugin:
lt_dlopen ("/usr/lib64/collectd/java.so") failed: file not found.
The most common cause for this problem is missing dependencies. Use ldd(1) or strings to check the
dependencies of the plugin / shared object. This is a result of libjvm.so being installed in a different
path by java-1.7.0-openjdk-headless. The solution is to find the path and create a symlink:
#path of java.so
$ strings /opt/collectd/lib/collectd/java.so | grep jre
/usr/lib/jvm/java-1.7.0/jre/lib/amd64/server
#path of libjvm.so
$ find /usr/lib/jvm/ -name libjvm.so
/usr/lib/jvm/java-7-openjdk-amd64/jre/lib/amd64/server/libjvm.so
#create a symlink:
$ ln -sf /usr/lib/jvm/java-7-openjdk-amd64/ /usr/lib/jvm/java-1.7.0

