Varnish

Varnish is a web application accelerator, acting as a caching reverse proxy to speed up delivery of your HTTP content and dynamic websites by an order of magnitude.
The Librato Agent gathers internal stats helping you track the health, performance, and effectiveness of your Varnish accelerators. We use collectd’s native Varnish plugin to gather metrics from your running HAProxy instances.
Installation
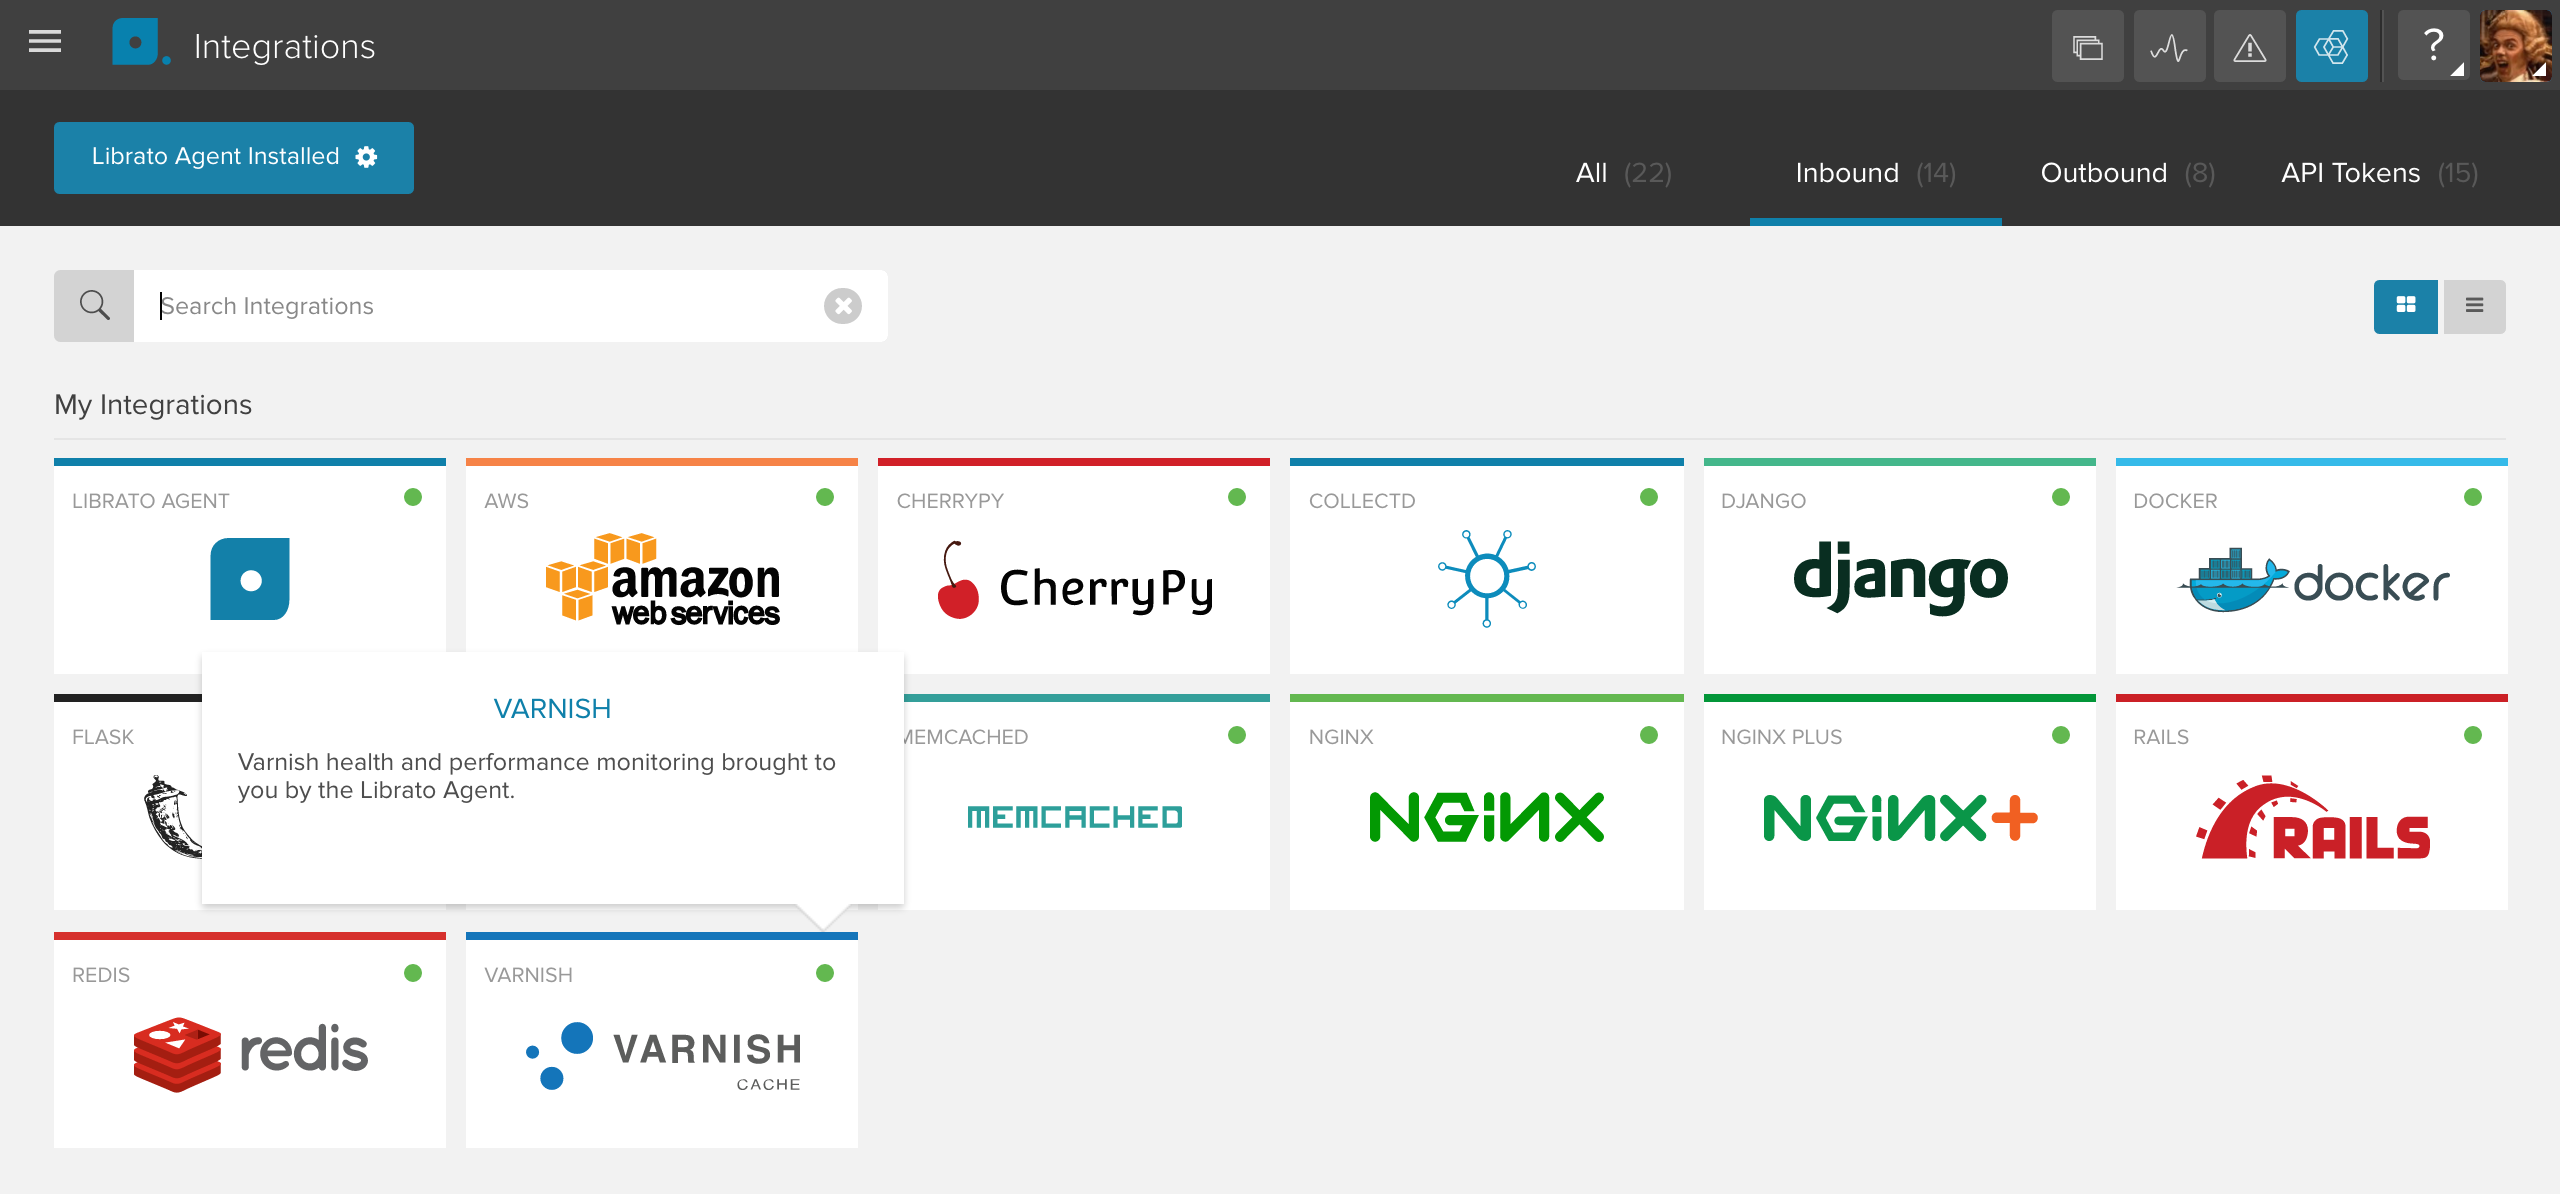
The Varnish integration depends on the Librato Agent. If you haven’t already, you will first need to install the Librato Agent. Once this is complete, select the Varnish icon in the integrations catalogue.

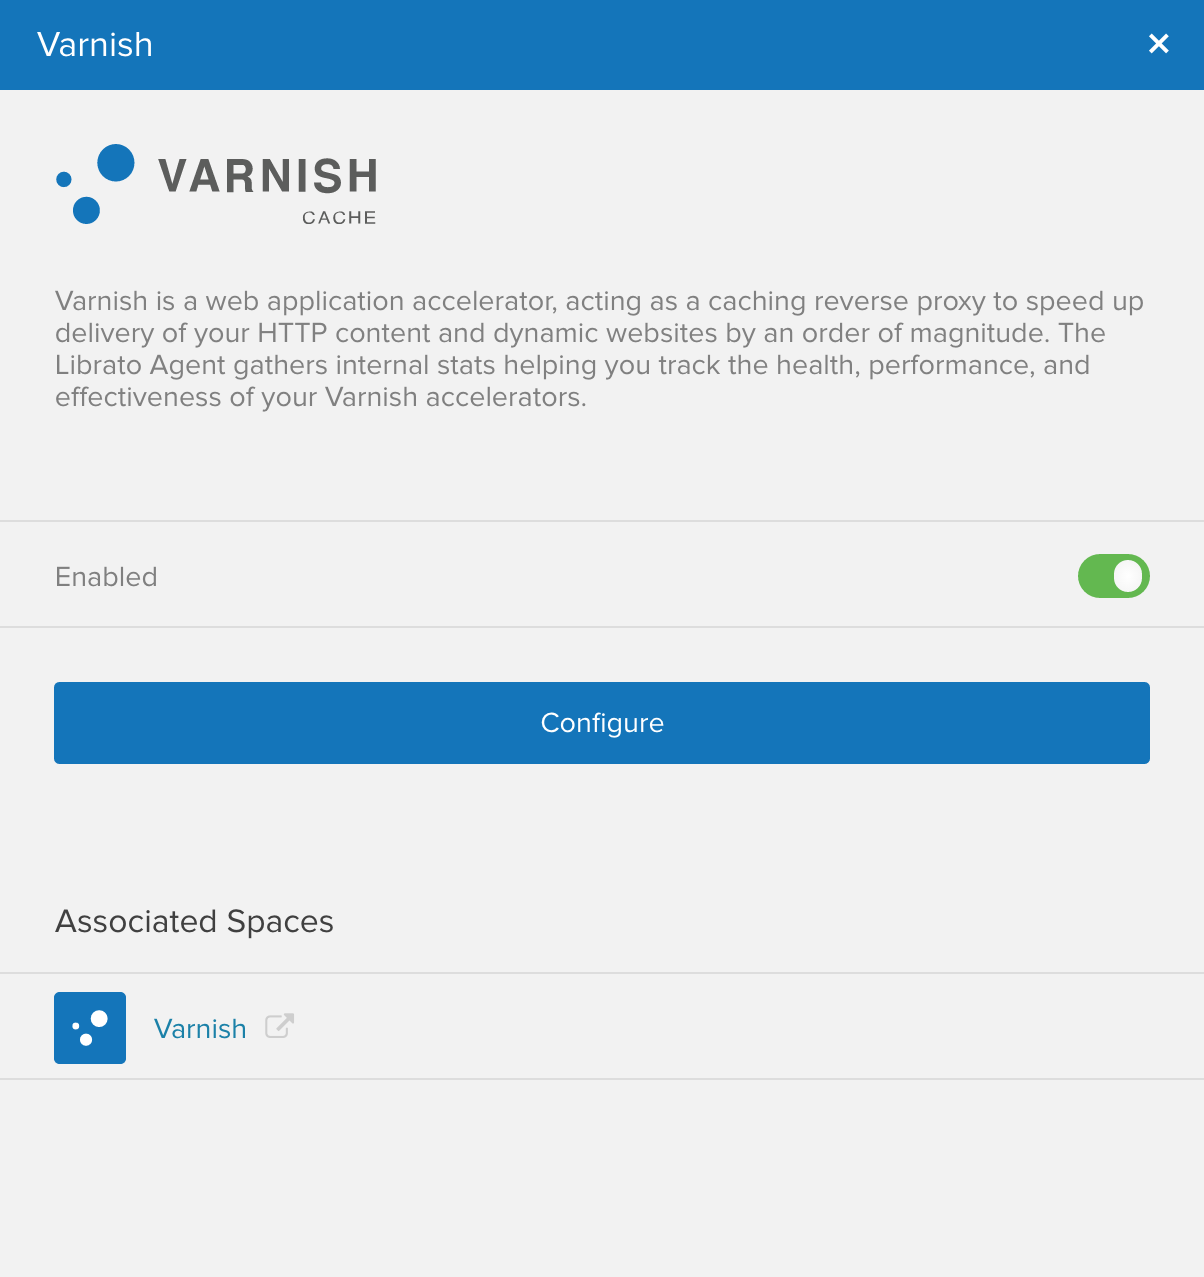
Toggle the Enabled switch to activate the Varnish integration on your Librato account and create the preconfigured Varnish Space.

At this point your integration is complete and any Varnish metrics associated with this integration will be allowed through your Librato Agent service-side filters.
Plugin Configuration
This integration gathers metrics from a running Varnish installation using the varnishstats utility. The most useful metric classes have been enabled out of the box. Additional metric classes can be enabled in the varnish.conf configuration file. Here is our default configuration for the Varnish plugin.
LoadPlugin varnish
<Plugin "varnish">
  <Instance>
     CollectBackend     true
     CollectCache       true
     CollectConnections true
     CollectFetch       true
     CollectObjects     true
     CollectSession     true
     CollectSHM         true
     CollectTotals      true
     CollectWorkers     true
  </Instance>
</Plugin>
Varnish Workspace
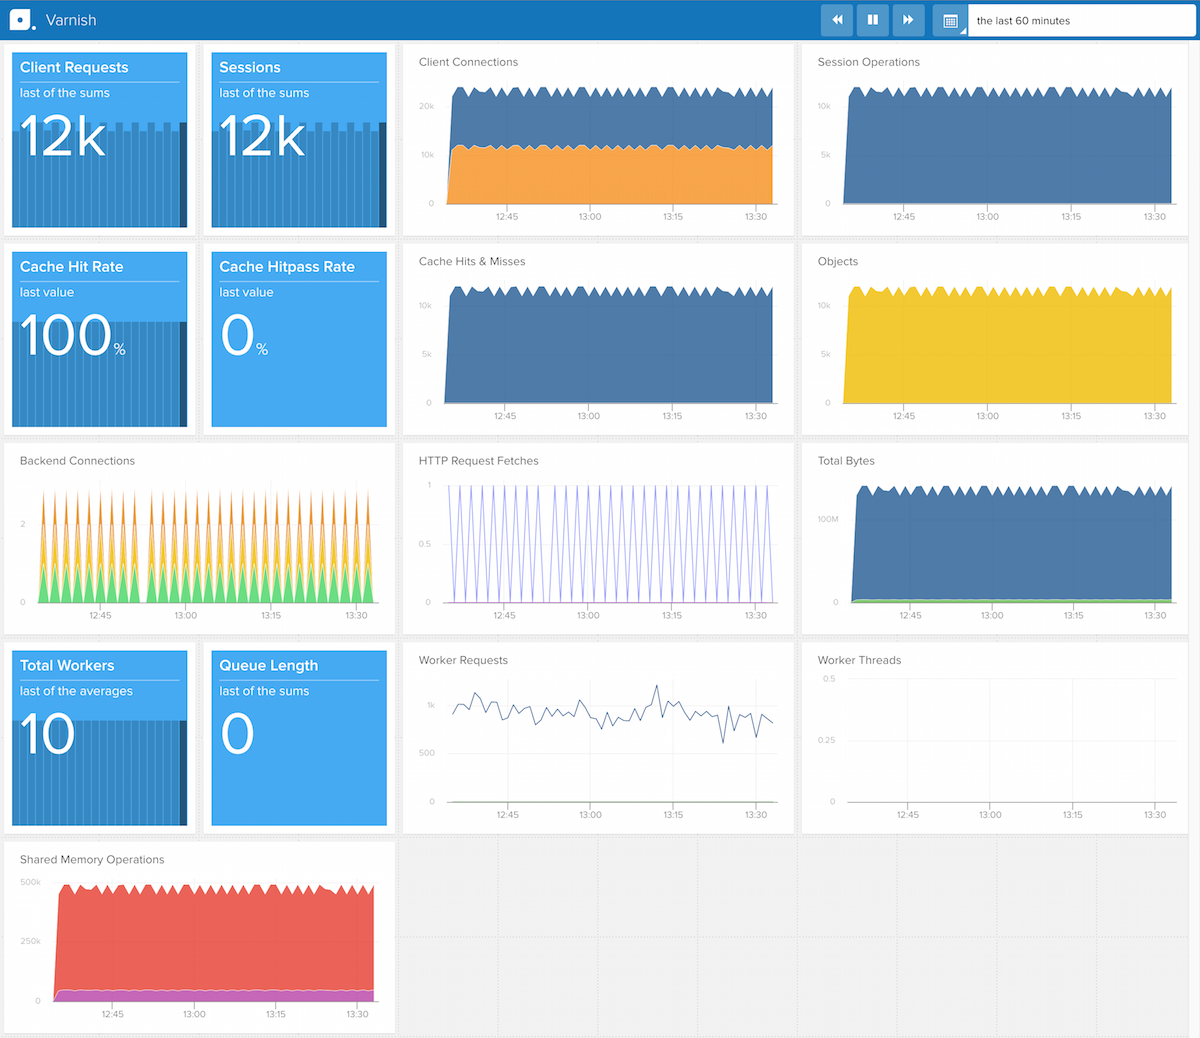
Visit your preconfigured Space to observe your new metrics as they stream in. You can use this Space to monitor the performance and overall health of your Varnish servers.

Varnish Metrics and tags
The varnish integration supports the following metrics and tags.
Note: All metrics are prefixed with librato.varnish..
| Tag Name | Description |
|---|---|
| host | Host name or IP address of monitored Varnish configuration |
Backend Metrics
| Name | Description | Tags |
|---|---|---|
| backend.connections.failures | Failed connections | host |
| backend.connections.not-attempted | Non-attempted connections | host |
| backend.connections.recycled | Recycle connectionms | host |
| backend.connections.retries | Retried connections | host |
| backend.connections.reuses | Reused connections | host |
| backend.connections.success | Successful connections | host |
| backend.connections.too-many | Too-many connection responses | host |
| backend.connections.was-closed | Was-closed responses | host |
| backend.http_requests.requests | Request counts | host |
Cache Metrics
| Name | Description | Tags |
|---|---|---|
| cache.cache_result.hit | Cache hits | host |
| cache.cache_result.hitpass | Cache hit-passes | host |
| cache.cache_result.miss | Cache misses | host |
Connection, Session and Fetch Metrics
| Name | Description | Tags |
|---|---|---|
| connections.connections.accepted | Accepted Connections | host |
| connections.connections.dropped | Dropped Connections | host |
| connections.connections.received | Received Connections | host |
| fetch.http_requests.bad_headers | Requests with bad headers | host |
| fetch.http_requests.chunked | Chunked requests | host |
| fetch.http_requests.close | Closed requests | host |
| fetch.http_requests.eof | End of file requests | host |
| fetch.http_requests.failed | Failed requests | host |
| fetch.http_requests.head | HEAD requests | host |
| fetch.http_requests.length | Length of requests | host |
| fetch.http_requests.no_body_1xx | 1xx responses without a body | host |
| fetch.http_requests.no_body_204 | 204 responses without a body | host |
| fetch.http_requests.no_body_304 | 304 responses without a body | host |
| fetch.http_requests.oldhttp | Old requests | host |
| fetch.http_requests.zero | Requests with 0 length | host |
| objects.total_objects.expired | Number of expired objects | host |
| objects.total_objects.header_overflow | Number of objects with header overflow | host |
| objects.total_objects.lru_moved | Number of moved objects | host |
| objects.total_objects.lru_nuked | Number of nuked objects | host |
| objects.total_objects.sent_sendfile | Number of sendfile objects sent | host |
| objects.total_objects.sent_write | Number of write objects sent | host |
| objects.total_objects.workspace_overflow | Number of workspace overflow objects | host |
| session.total_operations.closed | Closed session operations | host |
| session.total_operations.herd | Herd session operations | host |
| session.total_operations.linger | Lingering session operations | host |
| session.total_operations.pipeline | Session operations in the pipeline | host |
| session.total_operations.readahead | Read aheadsession operations | host |
| totals.total_bytes.body-bytes | Total bytes in body | host |
| totals.total_bytes.header-bytes | Total bytes in headers | host |
| totals.total_operations.fetches | Total operation fetches | host |
| totals.total_operations.gunzip | Total gunzip operations | host |
| totals.total_operations.gzip | Total gzip operations | host |
| totals.total_operations.pass | Total pass operations | host |
| totals.total_operations.pipe | Total pipe operations | host |
| totals.total_requests.requests | Total requests | host |
| totals.total_sessions.sessions | Total sessions | host |
Worker Metrics
| Name | Description | Tags |
|---|---|---|
| workers.total_requests.queued | Total worker requests queued | host |
| workers.total_requests.queue_length | Queue length for worker requests | host |
| workers.total_threads.created | Total number of worker threads created | host |
| workers.total_threads.dropped | Total number of worker threads dropped | host |
| workers.total_threads.failed | Total number of work threads failed | host |
| workers.total_threads.limited | Total number of worker threads limited | host |
FAQ
For specific answers to Librato Agent questions check out our Librato Agent FAQ.
Please let us know what you think about this integration. We would love to incorporate your feedback and any ideas you have on dashboard design into the ongoing development of our integrations.

