Service-Side Aggregation (SSA)
Service-Side Aggregation allows you to aggregate multiple measurements sent to the Librato API into a single complex measurement. You have always been able to aggregate individual measurements at the client-side with solutions like StatsD and the Aggregator for the librato-metrics Ruby gem. However, many times these client-side solutions are either not feasible to run or do not aggregate across collectors. Aggregating on the service side enables several different unique use-cases highlighted below.
If enabled for a metric, service-side aggregation will aggregate all measurements sent to the API with the same metric and tag set. Measurements are aggregated over the period of time defined in the metric’s attribute page. If a period is not set for a metric the default aggregation period is 60 seconds or one minute.
Aggregation operates the same as historical roll-ups. Aggregates are published as complex metrics allowing them to be plotted using summary statistic functions.
Service-side aggregation can work alongside client-side aggregation as well – client aggregates are aggregated similarly to individual measurements. An HTTP POST operation still has some time overhead, so it’s not recommended to make a request to the Librato API for every request into a user’s application. The client should instead aggregate multiple request measurements locally and periodically send those aggregates to the Librato API.
How to enable
To enable service-side aggregation via the API , set the aggregate attribute to true for the particular metric.
- Set the metric’s period to the interval you would like to aggregate over.
- If you do not specify a period, SSA will aggregate measurements to the default 60 second period.
- Metric aggregation periods are limited to a minimum of 10 seconds and a maximum of 600 seconds (10 minutes).
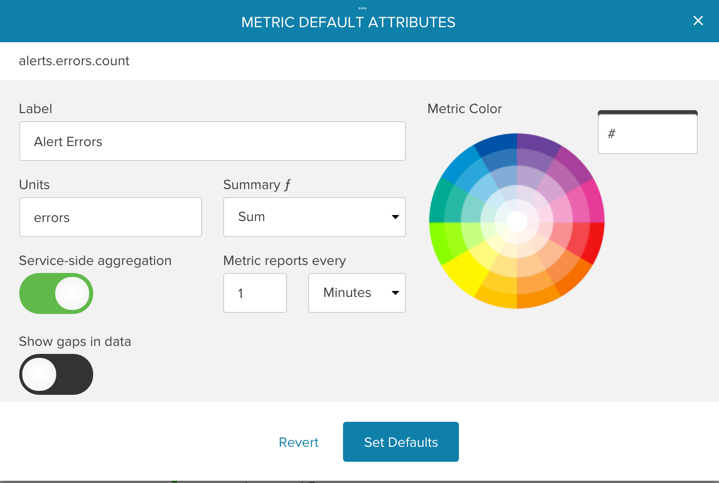
You can also enable service aggregation within the UI by selecting the “service-side aggregation” option and optionally setting a period using the option “Metric reports every X seconds/minutes”:

Use Cases
There are many use-cases that service-side aggregation enables.
Scale out tiers
Application services are frequently scaled over multiple threads, processes and servers. Without a centralized aggregation daemon like StatsD, it is difficult to build aggregate measurements that reflect global behavior across the multiple scaled components of the service. To track global metrics, each scaled-out component of the system should report their measurements using the same tag set. If service-side aggregation is enabled, all measurements with matching tag sets will be aggregated across the components. For example, to track request latency across the service, each component would send its individual request latency as such:
{"name": "req.latency", "value": 42.5, "tags": {"region":"us-west"}}
If each component is servicing a lot of requests, it may make sense to combine individual component aggregation with service-side aggregation. This reduces the overhead of making an HTTP POST request for every request into the application service.
Distributed Event Counting
It is oftentimes useful to count the number of events in a distributed system. For example, you might want to count the number of times a batch job fails to send an email notification. Without a centralized aggregation daemon on the client-side like StatsD, this is difficult to achieve.
With service-side aggregation you can increment a metric each time the
event occurs, maybe simultaneously, from multiple batch jobs. For
example, the following metric report would increment the
jobs.email_fail.count metric by one:
{"name": "jobs.email_fail.count", "value": 1.0, "tags": {"region":"us-west"}}
You should also set the metric’s attribute “How should we aggregate your data over time?” to “Sum”. This will ensure that the graphs always show the sum of the aggregate counts. See the article on metric attributes to set this attribute.
Synchronized Reporting
Stacked graphs work best when all the measurements points are aligned on the same reporting tick. The graphing SDK will try to interpolate and round offset measurements to the same tick boundaries, however it is still best to synchronize measurement reports on the same reporting boundaries when possible.
Service-side aggregation can be used to round measurements to the same step boundaries when submitting measurements. All aggregate measurements will be generated with their measure_time’s rounded to the aggregation period set for the measurement.
Automatic User Agents
There are several user agents that Librato detects and enables service-side aggregation by default for. We try to provide sensible defaults out-of-the-box and we believe that in most cases these user agents are used in scenarios where service-side aggregation is most appropriate.
If you report metrics with any of the following clients then service-side aggregation will be enabled by default when its metrics are created. You can disable service-side aggregation by setting the aggregate attribute to false via the API or unchecking the service-side aggregation box in the UI.
- librato-rails
- librato-rack
- metrics-librato
- Segment.io integration
- PapertrailApp integration
Pricing
We only charge for the measurements that are stored in the service. If you aggregate multiple measurements per-minute we only charge you for the single aggregate measurement that is stored (based on the period you choose).

