Tutorial
Composite metrics let you define a new higher-level metric by specifying an arbitrary set of mathematical transformations to perform on a selection of native metrics or time-series you’re sending to Librato. Alternatively you can think of composite metrics as a way to specify arbitrarily complex queries against your native metrics.
Composite metrics can be saved in charts, and correlated with native metrics in the same chart. You can assign properties like y-axis titles and tool-tip aliases to them just like you do to native metrics.
There are two ways to create composites: in a chart and as a persisted composite.
Composites in a Chart
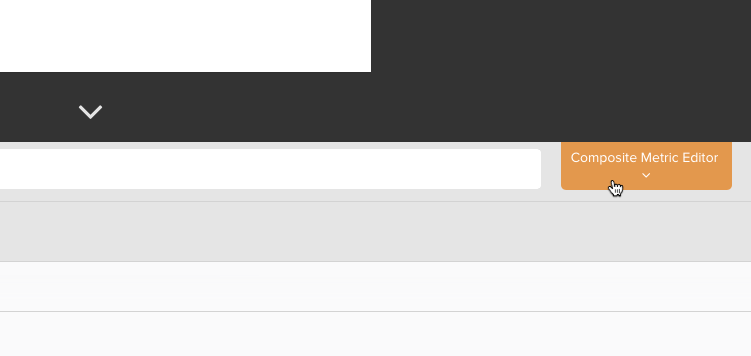
To create a composite in a chart, create a new chart or edit an existing one, then click on the Composite Metric Editor button to the right of the metric search field. This will open the composite editor.

Persisted Composites
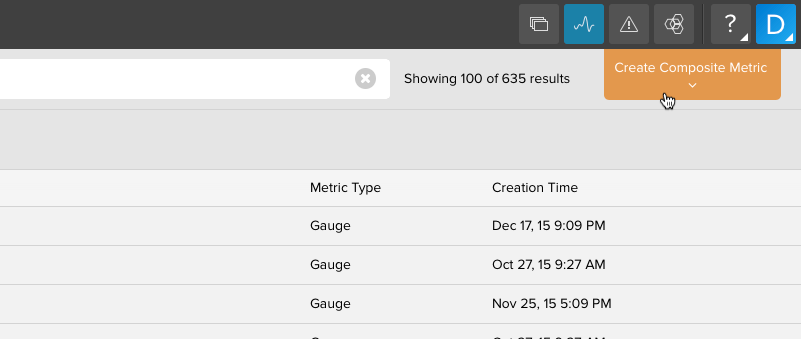
Composites can be saved for using on multiple charts or to use as an alert condition. Head on over to your metrics tab and click on the Create Composite Metric button in the upper right corner.

From there you can enter in the composite definition and save it so it can be used globally like you would use any other metric.
Composing Metric Queries
The composite metrics editor prvoides a text field into which you can type a query that will create a composite metric in the graph. Queries are composed of time-series wrapped in functions in the general form:
function(series(metric,source)))
NOTE: You cannot nest composite metrics.
Lets take a quick tour of the DSL used to create and work with composite metrics.
Sets and the Series() Function
Composite metrics are created from sets and functions. A time series is a stream of time-aligned measurements of the sort that is identified by a combination of metric name and source name in our metrics platform. A set is a list of time series. For example, if you have a metric called cpu.load.5min, and three sources (server1, server2 and server3) which emit that metric, then the combination of the metric name and wild-card: cpu.load.5min,server* specifies a set of three time series: cpu.load.5min across each of the three different servers.
The series() function is used to retrieve sets of measurements from your existing metrics data. It takes three arguments; the first: metric name, and second: source name, are required, and the third is optional (we’ll get to that in a moment). Continuing our system load metric example, this call…
series("cpu.load.5min", "*")
… will retrieve the set of measurements from all three servers, while this call…
series("cpu.load.5min", "server1")
… will retrieve only the set of measurements from server1. You can use wildcards in the metric name too. So a series() invocation like this…
series("cpu.load.*","*")
… will retrieve a set containing the 5, 10, and 15 minute cpu load metrics from all servers.
Varying the Summary Function
By default the summary statistic function used in each time-series is the average, you can change this by setting the function option to the series call to one of min, max, count, sum:
series("cpu.load.*", "server*", {function:"sum"})
Varying the Resolution
You can also alter the granularity of the summarized data. By default a query for the last 14 days will return time-series with hourly datapoints i.e. period=”3600”. With the period option you can specify an arbitrary resolution in seconds to which the datapoints should be rolled up. For example, to specify daily resolution using sum as the summary function:
series("cpu.load.*", "server*", {function:"sum",period:"86400"})
Shorthand Notation
As every composite metric definition contains at least one invocation of series() and more sophisticated defintions may contain several, our grammar supports s() as an equivalent shorthand notation e.g.:
s("cpu.load.*", "server*", {function:"sum",period:"86400"})
Sets of sets
Finally we can create sets of sets by square-bracketing series() calls. We can use this to specify multiple series as a single argument to functions like divide(), as we’ll see shortly, or to make more specific typeglobs, for example to specify the 5 and 15 minute load averages, but not the ten minute average we could use:
[s("collectd.load.load.short*","*"),
  s("collectd.load.load.long*","*")]
Dynamic sources
When you embed a metric in an instrument, our user interface supports the concept of dynamic sources, which is a fancy way of saying that you’ll specify the source later on when you actually want to view the data. You can use dynamic sources in your composite metric definitions by using % in lieu of the source argument to series(). We could make our set of load averages dynamic like so:
[ s("collectd.load.load.short*","%"),
  s("collectd.load.load.long*","%")]
Aggregation and Transformation Functions
Composite metrics are created by applying transformation and aggregation functions to the native time-series data returned from series(). Each function takes both a set as input and returns a set as output, so functions can nest each other ad infinitum. At the moment there are 6 functions.
sum()
The sum() function aggregates the input set down to a single series by adding together the measurements at each time interval. You get a single time series consisting of all the input series added together.
If, for example, you had several metrics that tracked the occurrences of HTTP response codes in your logs, you could get a total count of HTTP 400-series errors using the sum function like so:
sum(s("prod.log.http.4*","*"))
You could use a set of sets to capture 400 and 500’s like so:
sum([s("prod.log.http.4*","*"),s("prod.log.http.5*","*")])
subtract()
The subtract() function takes a set of exactly two time series and returns the result of subtracting the second from the first.
Continuing from the last example, if you tracked the occurrences of HTTP response codes in your logs, you could get a count of all non-200 responses by combining sum() and subtract() in a set of sets like so:
subtract([sum(s("prod.log.http.*","*")),sum(s("prod.log.http.2*","*"))])
max()
The max() function aggregates the input set down to a single series by discarding all but the largest measurement at each time interval. You get a single time series consisting of the largest single measurement from each of the input series.
If you wanted to monitor load average site-wide with a single line, you could use the max() function to display the site-wide maximum load average.
max(s("collectd.load.load.*","*"))
min()
The min() function aggregates the input set down to a single series by discarding all but the smallest measurement in each time interval. You get a single time series consisting of the smallest single measurement from each of the input series.
You could add a lower bound to the site-wide load average graph with a call to min() like so…
min(s("collectd.load.load.*","*"))
mean()
The mean() function aggregates the input set down to a single series by computing the mean of all measurement in each time interval. You get a single time series consisting of the mean of the input series.
Adding the mean to our site-wide load average graph with mean() like so…
mean(s("collectd.load.load.*","*"))
… yields a graph that represents the CPU load of every host in our entire production infrastructure:
derive()
The derive() function is useful when you want to view the rate of change of a given metric - how much it increases or decreases from one measurement to the next. It transforms the input set by computing the derivative of each series in the set. Unlike the functions we’ve discussed thus far, derive() doesn’t aggregate, or combine the input set, you get as many series out as you put in. In order to avoid certain edge cases involving late-arriving data, we recommend that you push calls to derive() to the lowest, or innermost, possible level, e.g:
sum(derive(series()))
is preferable to:
derive(sum(series()))
You can track the rate of customer signups by using derive() to graph the rate of change in a total user count metric.
derive(s("prod.myapp.users.count", "*"))
divide()
It’s often useful to calculate the ratio of two metrics. The divide() function takes a set of exactly 2 time series and returns the result of dividing the first by the second (The first set is used as the dividend and the second, the divisor). Continuing the last example, if we were tracking sign-ups and churn on a per-server basis, you could track the ratio of new customers to cancellations by first aggregating all of the per-server stats with sum(), and then dividing the result like so:
divide([sum(s("prod.myapp.signups", "*")), sum(s("prod.myapp.cancels", "*"))])
A real-world use-case
The Collectd server-monitoring daemon reports CPU usage broken out per-core and per-type e.g.:
collectd.cpu.0.cpu.user
collectd.cpu.0.cpu.system
Assume we want to graph the total system CPU usage on a server server-instance-1. We’d start constructing our composite metric by retrieving the native metrics that detail system CPU usage for each core:
series("collectd.cpu.*.cpu.system", "server-instance-1")
Collectd reports it’s CPU usage as an always-increasing counter of time consumed, so to see the rate of change we’ll use the derive() function:
derive(series("collectd.cpu.*.cpu.system", "server-instance-1"))
To get a total usage for the server instance, we’ll aggregate the per-core metrics with the sum() function:
sum(derive(series("collectd.cpu.*.cpu.system", "server-instance-1")))
Now we can see how the system CPU usage changes over time, but it’s still in abstract units of time. It’s more useful/intuitive to examine system CPU usage in relation to the total capacity available on the server. We can effect this by taking a ratio of the system CPU usage to the total CPU usage (which include idle). Note that we used the [series1, series2] set notation to specify the inputs to divide():
divide([sum(derive(series("collectd.cpu.*.cpu.system","server-instance-1"))),
  sum(derive(series("collectd.cpu.*.cpu.*","server-instance-1")))])
Finally we can make our composite applicable to any server by switching to a dynamic source and slightly briefer with the s() shorthand for series():
divide([sum(derive(s("collectd.cpu.*.cpu.system", "%"))),
  sum(derive(s("collectd.cpu.*.cpu.*", "%")))])
If you have questions about composites, contact support or post a question on StackOverflow using the #librato tag.

