
Dynamic Source
When creating charts (and by extension Spaces) you generally specify a metric and the particular source to which the instrument pertains. You may have a scenario where you will want to apply the same curated set of visualizations across several homogeneous sources. While wildcard sources provide some flexibility, instrument templates aka “dynamic source” solves that in a much more elegant way.
With the Dynamic Source feature you can dynamically modify the source being visualized.
When you edit a chart, you can specify the source for each metric or annotation on the chart. Click on “source name” menu and select Dynamic.
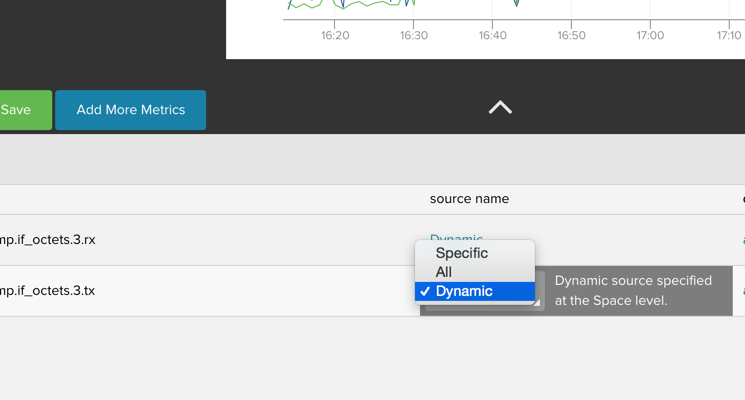
A new field appears in the header of the page that allows you to enter the source name or a name pattern. Immediately after entering the source name the graph is rendered with the source you specify.
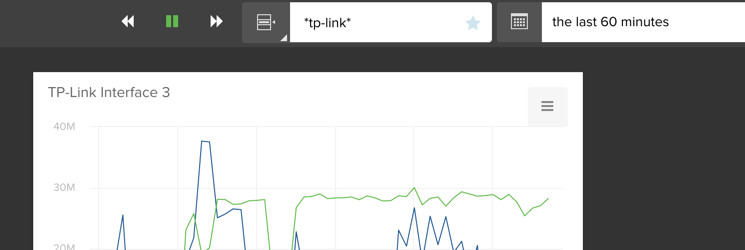
The template lets you change * to *foo or *bar or ‘explicit-source’ rapidly without modifying the underlying instrument resource. When you change that field it also updates the URL, for example
https://metrics.librato.com/s/spaces/123/?source=*
…will change to…
https://metrics.librato.com/s/spaces/123/?source=*bar
when you change * to *bar in the dynamic source field, so you can bookmark a URL that has the source parameter set.
A valid dynamic source string can also specify multiple individual
sources separated by /\s+OR\s+/ i.e. OR . Note that the
‘OR’ operator must be in between two valid sources, i.e.
/^\s*OR\s+/ and /\s+OR\s*$/ will not parse. Each individual
dynamic source can also be negated with a prepended ‘!’. There can be
no whitespace between the ‘!’ and the negated source. Example:
foo OR !bar.
Please note: AND is currently not supported and you may see unexpected results if you try to use it.
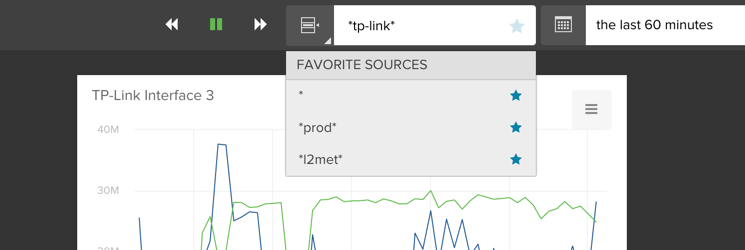
To avoid having to re-type commonly used source name patterns or to simplify sharing source names in a team environment you can favorite source names. Just click on the star next to the source name and it will show up in the source field pull down menu.
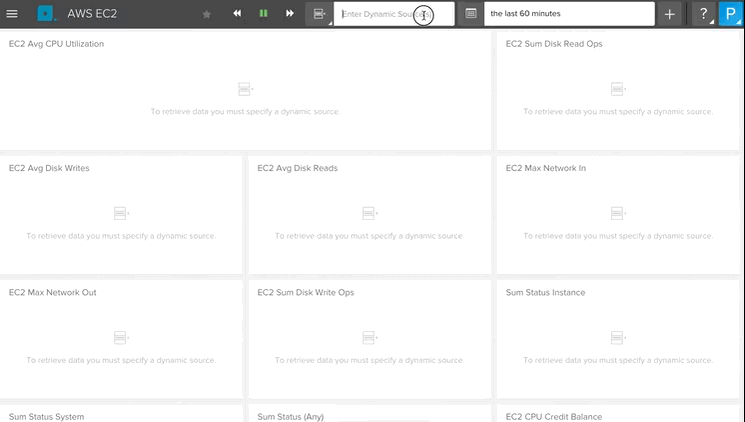
If you add a chart that you created with a dynamic source to a Space the dynamic source field will appear in the menu bar that allows you to specify the source for all the graphs in the Space.
We hope this enables people monitoring large number of homogeneous sources (e.g. servers, sensors, users, etc) to curate a single set of per-source spaces and then apply them to a given source when fire-fighting/investigating.