
Librato Introduction
From a very high level, this is the Librato workflow:
- You send Metrics to our RESTful API.
- You use our UI to create a Space, add a new Chart, and assign one or more of your metrics to it.
- You add other charts to the space and arrange them to suit your needs.
After first signing up
When you first sign up with Librato you will be guided through the setup process. The quickest and easiest way to get started is to use one of the turnkey integrations. These solutions offer the quickest path to get from configuration to curated dashboards for things like servers metrics, Docker, Redis, AWS Cloudwatch and many other services.
You can of course also start by sending metrics to our RESTful API. On the first screen of the guided tour, click on the “I’m a Librato Pro! Take me to the API Tokens.” link to grab a token.

Getting metrics into Librato
Before you can add data to a chart you need to begin emitting metric data to our API. There are three ways to get data into Librato:
If you choose an integration from the Integrations Catalog you will be guided through the setup.
To emit metrics to Librato from any of the large selection of open source collection agents or from any popular programming language via a native language binding, you will need to grab a token. You can find existing tokens or create new ones on the Integrations page under the API Tokens submenu.
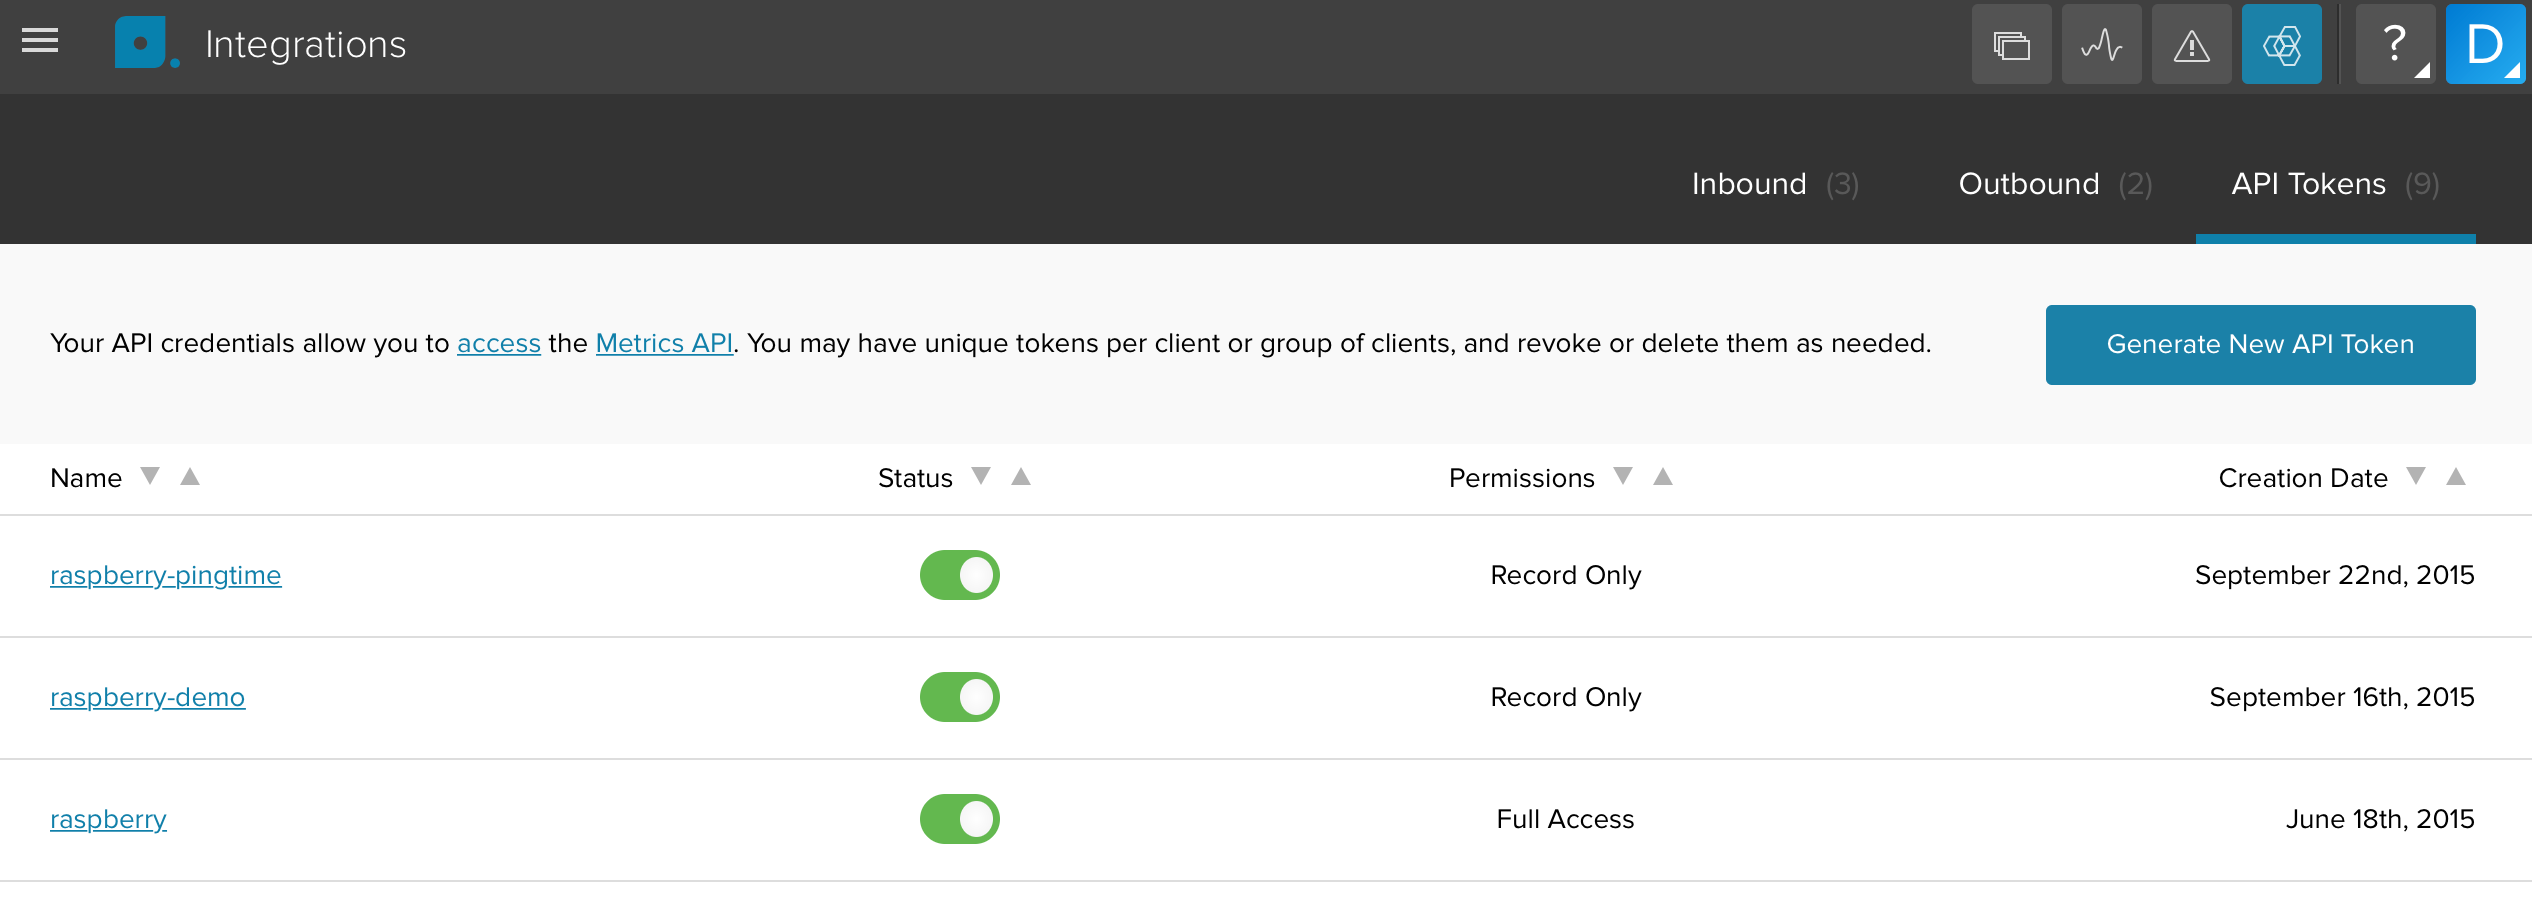
You’ll find a comprehensive list of agents and bindings on the product page on our marketing site.
Metrics and Sources
Librato is a hosted telemetry system for time-series data. You POST key/value pairs along with a timestamp to our API, and we take care of storage, and provide awesome visualization and alerts.
Librato’s notion of a metric might be a little different than what you may be used to. We use a two dimensional namespace that separates metric names, and source names. The metric name refers to the variable you are measuring, like CPU Load, or Thread Count. The source name usually refers to the instance you are taking the measurement from, like Server Name, or the name of the Application or Service. Separated from the metric name, the source name is a very powerful filtering tool which, as we’ll see further down, makes it easier to build charts and seamlessly visualize short-lived entities like threads and jobs.
To add a new chart to a Space, click the plus sign in the upper right-hand corner, and select the type of chart you’d like to add (Don’t worry, you can change the chart type later).

Charts
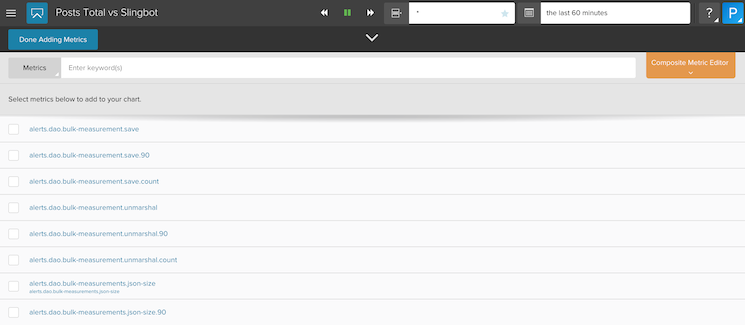
A few seconds after you send a measurement to our API, the metric will appear in the metrics list in the chart editor. Simply check it to add it to the chart.
When you first add the metric to a chart, it’ll default to displaying the average of all the sources that are reporting that particular metric. If you’d like to see each source individually you can change the source summarization to “breakout”.
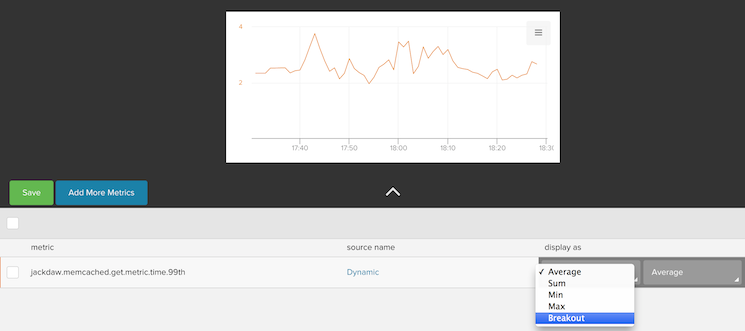
Broken out, the chart will display one line for each source name you’re emitting.

You can filter the individual sources with the source name field. By default this field is set to Dynamic. We’ll see what that means in a moment.
Spaces
Spaces is our primary user interface. You can create as many Spaces as you want, and use them to present charts that depict related metrics. At Librato, for example, we have a Space for each service that we run in our micro-services infrastructure. All charts in a space automatically refresh, and mousing over a chart will pop-up a tool-tip legend and cursor-tracking line, which makes it easy to correlate events and data across every chart in the space.
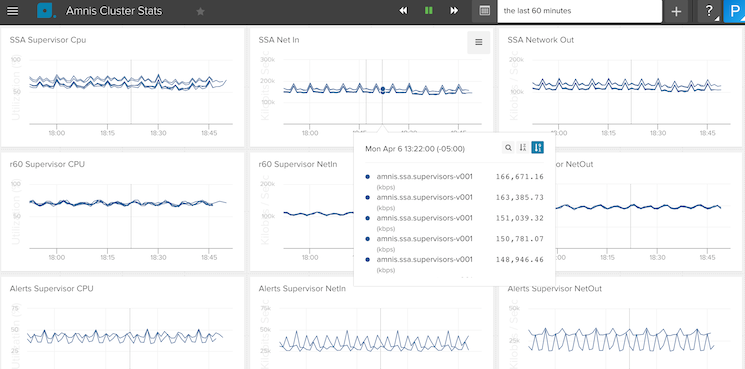
At the top of the space you’ll notice a date-range selector and rwd/pause/fwd buttons which you can use to explore back in time, or pause the charts at a particular day/time range. If any of the charts in a space are configured to use dynamic sources, the space will also have a field for you to enter a dynamic source.

Every chart in the space that is configured to use dynamic sources will
reflect the typeglob entered in this field. If, for example, you are
using server-names as the source, and your naming convention is
type-ID-env (eg web-14-prod), you can use the dynamic source field to
quickly show you all the production data by entering *prod* in the
dynamic source field.
Alerts
We believe that Alerts are a fundamental component of a monitoring service. You can create alerts for any metric you send to Librato.
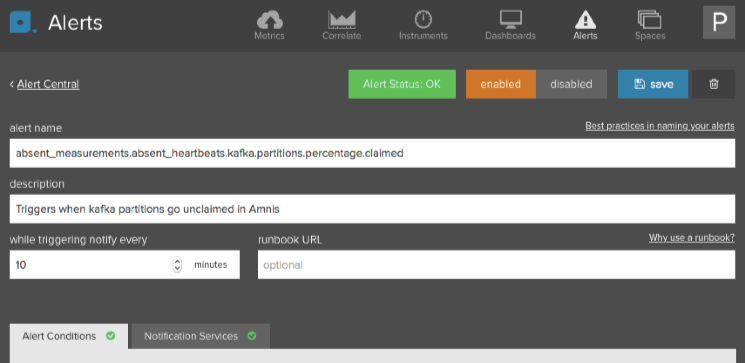
For each alert you set up we create an annoation
stream with the alert name prefixed with librato. That way you can overlay
alert annotations over any metric.
Bookmarking and Sharing
Our URI’s always include unique query parameters i.e. source,
duration, and (in the case of custom date ranges) end_time, which
makes it easy to bookmark your favorite Spaces, and craft links that
specify specific date ranges et al. If you want to share a chart or
space with a collaborator
just send them the URI and they will see exactly what you see.
If you want to share a chart with an external entity, or embed a chart in a chat service like Slack, you can use our snapshot feature, which allows you to seamlessly snapshot and send straight from our UI.
