The Legacy UI
If you signed up before April 2015, you have access to both the Legacy Librato UI and the new Spaces UI. Spaces was created leveraging years of feedback from our user community to optimize the workflow and the look and feel. For an introduction to Spaces please read Librato Introduction.
From a very high level, this is the workflow in the legacy UI:
- You send metrics to our API and they show up under the Metrics tab.
- Under the Correlate tab you create Instruments containing one or more metrics.
- Instruments can be placed on Dashboards.
After first signing up: The Simulator
When you log in to Librato for the first time you are presented with a simulator that generates some metrics for you so that you can experiment the service. If you want to re-start the simulator, just delete all your metrics and it will pop up again. Here’s a quick (90 second) intro video:
Getting metrics into Librato
To send data to Librato you can use open source collection agents, language bindings or a simple curl command. You can find a list of agents and bindings on the product page of our marketing site.
Fundamentally, Librato is a time-series data service. You POST key/value pairs with a timestamp to our API with optional source associations and we take care of storage, visualizations and alerts. Librato uses a two dimensional namespace: you defined metric and source names. A source can be anything - the most typical use case is a server but it can be a process, a user or a worker. As will learn, the source name can be a very powerful filtering tool.
Metrics

The Metrics page is the first one you land on when you log in to the app. This page presents you with a list of all the metrics you are sending to Librato.
Narrow down the list by typing a pattern into the search box. As soon as you start typing the list is filtered. When you click on a check box next to a metric, two buttons appear - the Delete and Attributes buttons. This allows you to easily mass-edit metrics.

Metrics appear as soon as you POST a metric to our API. Click on the metric to see the metric details including the metric attributes, all the sources associated with the metric and alerts.
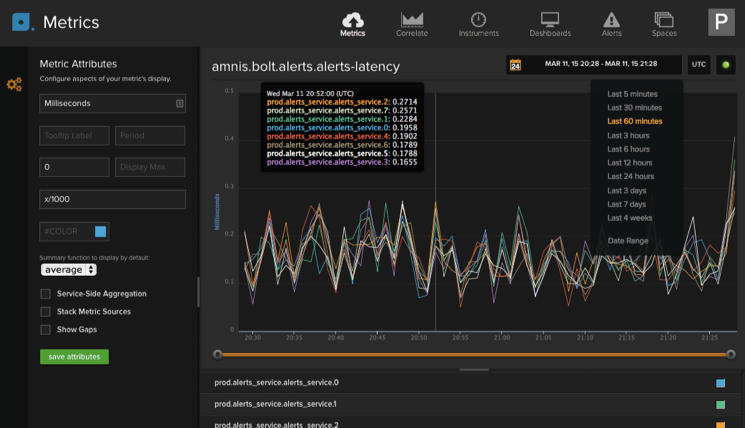
The sources are listed below the graph. If you don’t specify a source
when you send data to the API your metrics will all get pushed under the
umbrella unassigned source. If you have a metric with a lot of
sources you can filter the graph by using the stream filter below the
source rows. Type in a pattern (you can use the * wildcard as well),
e.g., *prod*, and the graph will only show the sources that contain
*prod* in their name.
Attributes
All the metric attributes are in the panel on the left hand side of the Metrics page. The display name of the metric is also editable by just clicking on it - don’t forget to click on “save attributes” when you are done.

The attributes you can edit are:
- Y-Axis label: Name for the y-axis, also what determines if a y-axis is shared by multiple metrics in an instrument.
- Tooltip label: Units that display in the tool tip.
- Period: Interval at which you are sending us data. If the period is set, gaps will show for periods where no data is received. If it is not set, data points will be connected. Enter an integer for the amount of seconds. You can read more in the API docs.
- Display Min: Set the minimum value of the y-axis, e.g. if you only expect positive values you can set this to 0.
- Display Max: Set the maximum value of the y-axis, e.g. if you are tracking a percentage you can set this to 100.
- Simple Display Transform: Transform the graph based on a simple formula. For example if you are measuring temperature via a sensor you can use the simple display transform to convert the graph from Fahrenheit to Celsius by entering (x-32)/1.8 into the display transform field. Permitted variables are x (data point) and p (period). Read more about Simple math on graphs (aka display transform).
- Color: Set the color of your metric either via hex code or the color picker (read How to change the colors on a metric).
- Summary function to display by default: This affects how your data is handled when we roll it up. By default we will average your data. Other options are sum, min, max, or count.
- Service-Side Aggregation: Checking this will enable service-side aggregation. Note: This is only available on gauge metrics.
- Stack Metrics Sources: Displays a stacked graph of all the sources of the metric instead of plotting individual lines.
- Gap Detection: Some metrics are reported opportunistically i.e. every n seconds a measurement is sent only if there is new data. This results in a sparsely populated series. When the Period is set, and gap detection is enabled, we render it as a set of invisible dots.
PRO-TIP: always set the Y-Axis Label and Period.
Mass Editing Metrics
To either delete or change the attributes of multiple metrics, use the search box to filter out the metrics you want to edit and then either check the box next to each metric or check the box next to “NAME” to select all the metrics in the list - once a box is checked the Delete and Attributes buttons appear (see the first image in this article).
Clicking on the Attributes button will bring up a modal window that allows you to choose which attributes to edit and to define the value for the attribute. The mass-edit functionality is also accessible via the Instrument view. Just check the metrics you want to modify and click on the button with the cogs to pull up the attribute editing modal.
Correlate

Build instruments by correlating metrics from any source. This is a great tool for fire-fighting or just building a grouped set of metrics and saving them as an instrument that you can then display on a dashboard. Saved instruments are listed on the Instruments page.

Selecting a metric.
To correlate metrics, start by searching for metrics. When you start
typing the metric name in the search box it will narrow down the list of
metrics displayed. You can also use the infinite scroll to find the
metrics you want. Simply hover over the metric to reveal a ‘+’ then
click on the ‘+’ to add the metric to the instrument. By default the
metric is added with a wildcard * as the source.
Metrics that are already added to the instrument have a green check
mark.
Each metric will have its own y-axis unless you set the metric attributes so that metrics share a y-axis. Read more under Manage Metric Attributes.
Selecting a source type.
Once a metric is added to the instrument you can change the source. Click on the target symbol in the source column to get the source selection menu.
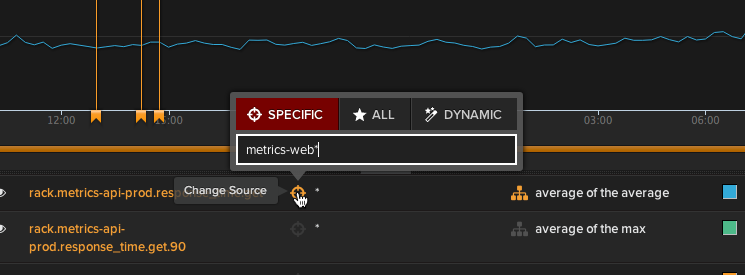
You can choose between All sources, dynamic source or specific source. The system wide default for the source setting is set in your account settings.
When you choose dynamic source it opens up a form field that let’s you type in a source name pattern. To learn more about dynamic sources please read Dynamic Source.
When you select specific source, you can type in the source name. As
you type, a list of source options is displayed. You can use name
patterns as well such as *prod*. After you have added a metric with a
specific source it will show a green check mark next to it in the panel
on the left. You will notice when you hover over the green check mark it
turns into a ‘+’ again. This allows you add the same metric again and
choose a different source.
Stream Composition
If you selected a source type that is not specific to one source (for
example ALL or *) you will be able to define how the data is
aggregated over time and across the sources.
Clicking on the aggregation icon (looks like an org chart) brings up the stream composition menu.

The left box defines how you display all the sources (the z-axis). The options are:
- average
- sum (use this for gauges that are counters)
- min
- max
- breakout (displays one line per sources)
The right box defines how you summarize each source across time (the x-axis). When you are sending a gauge type metric the options are:
- averages
- sums
- mins
- maxes
- counts (this is the count of measurements in the period)
If you are sending a metric of type ‘counter’ we show the derivative.
With stream composition you can add the same metric to a graph multiple times and choose different aggregation combinations such as max of the max, min of the min, or breakout of the averages:

Manage Metric Attributes
You can also manage attributes of multiple metrics simultaneously from within the instrument builder. Just check the metrics you want to modify and click on the button with the cogs to pull up the attribute editing menu.
You can use this feature to make multiple metrics share the same y-axis on an instrument. Check the boxes of the metrics you want to edit and give them all the same Y Axis Label.
Instrument Attributes
Clicking on the cog icon on the left opens the Instrument Attribute panel which allows you to choose a stacked graph view or to overlay an integral on the graph (sum of all points for the time period).
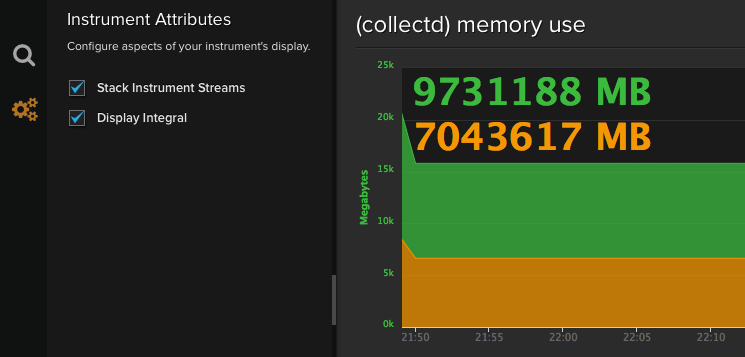
Stacked Graph.
If you have several metrics that make sense to display as an aggregate (e.g. cpu.system and cpu.user) you can select the “Stack Instrument Streams” box. The metrics must be configured to use the same Y-axis label (see Manage Metric Attributes).
Display Integral.
The “Integral” check box allows you to display an integral of the metric across the selected time period - it shows as a number superimposed on the graph.
Remember to always save your work! Don’t forget to save your configuration so that you can quickly refer to it in the future or you can add it to a dashboard. Every instrument you save is listed on the Instruments page.
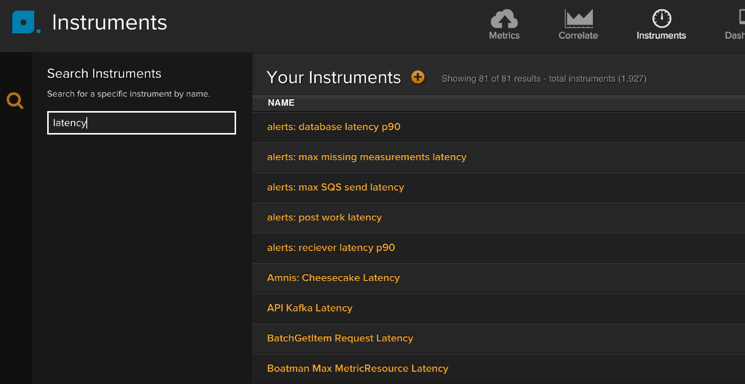
Instruments

Instruments are a saved grouped set of metrics. The Instruments page presents you with the list of all instruments you have created.
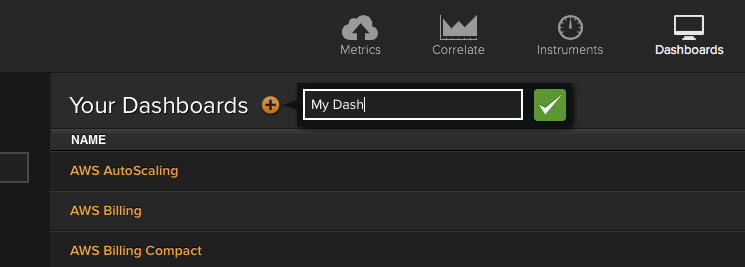
Dashboards

On the Dashboards page you will see a list of all the dashboards you have created.
You can create as many dashboards as you want and populate them with instruments. To create a new dashboard click on the (+) sign.
Clicking on the dashboard name will open up the dashboard.

Adding Instruments
To add an instrument click on the (+) button at the bottom right of the page. This will open a modal window.
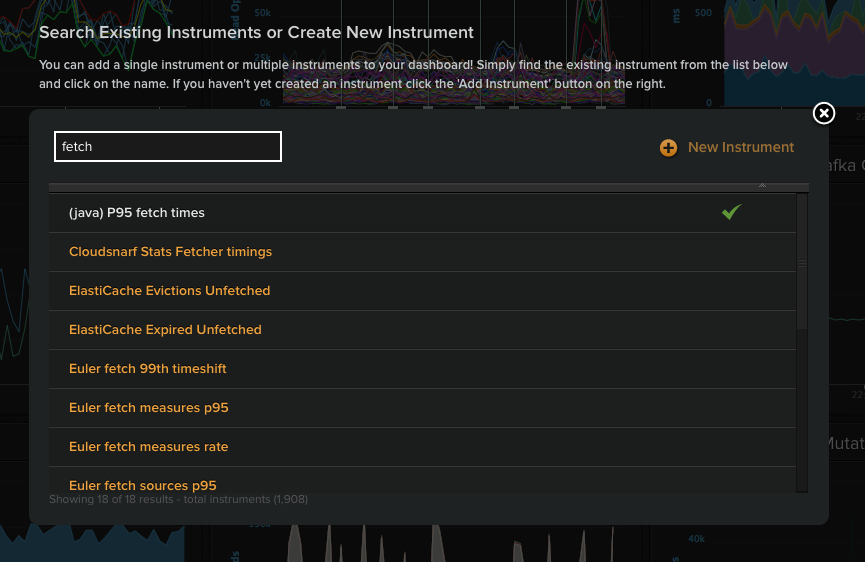
In this window you can select all the instruments you want added to the dashboard. Use the search box to narrow down the number of instruments listed and click on the instrument to add it to the dashboard (a green check mark will show if the instrument has been added). If you click on (+) New Instrument, you will be taken to the Correlate page.
Reordering instruments
To reorder instruments simply use the cross icon to click and drag it to where you want it.
Sharing Dashboards
Click on the share icon in the bottom right hand corner of the dashboard to share your dashboards.
Auto Refresh, Date Picker, Intelligent Sizing
All instruments auto-refresh with an interval based on the shortest associated metric period. If no periods are set, it should refresh on a 30 second interval.
Each dashboard has a single date-picker that changes the time-interval in lockstep for all enclosed instruments.
Our dashboards intelligently size themselves to whatever display you’ve loaded them on, so they look great on anything from an iPad to a wall-mounted 1080p display.
TIP: In the Librato office we have Chrome loaded with multiple dashboards and use the Revolver plug-in to automatically switch between the open tabs. That way we always have an eye on all the key metrics we need to track.
Another TIP: If you only have a few instruments on a dashboard and would like them to use up more dashboard real-estate you can use the browser’s zoom function to scale the graphs. Chrome/Safari/Firefox: press and hold the “Ctrl” (PC) or “Command” (Mac) key, and then press the “+” to zoom in. Press and hold the “Ctrl” or “Command” and “0” to return the zoom to its default value.
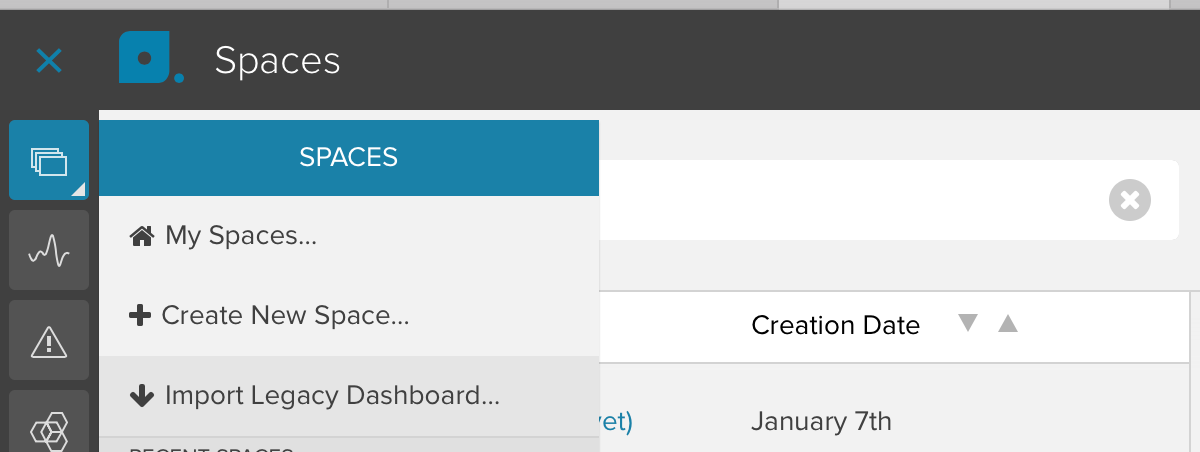
Importing Legacy Dashboards to Spaces
You can import any existing Dashboard directly into a space using the following menu item: