
How to control gauge aggregation
A gauge is the most basic and flexible type of metric. It’s a series of <key, value, source, timestamp> measurements. You can therefore use gauges to track several types of metrics e.g. timings, rates, counts, etc whose individual measurements all fit the gauge model. When you want to combine individual measurements across the dimensions of either time or space (i.e. source), the semantics diverge. As such we’ve provided fine-grained controls that enable you to control aggregation on each dimension independently.
Summarization over Time
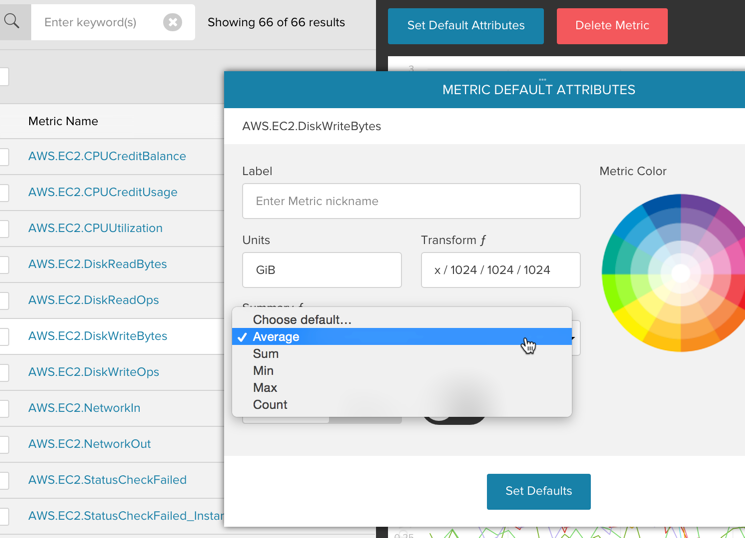
As your measurements age we automatically summarize them into single measurements covering larger periods of time. You can control the function used to display a metric’s measurement over time through the metric’s attributes.
Aggregation across Sources
When you report the same metric from multiple sources, it’s often useful
to aggregate the same metric from multiple sources into a single
representation. We provide a mechanism for this through our wildcard
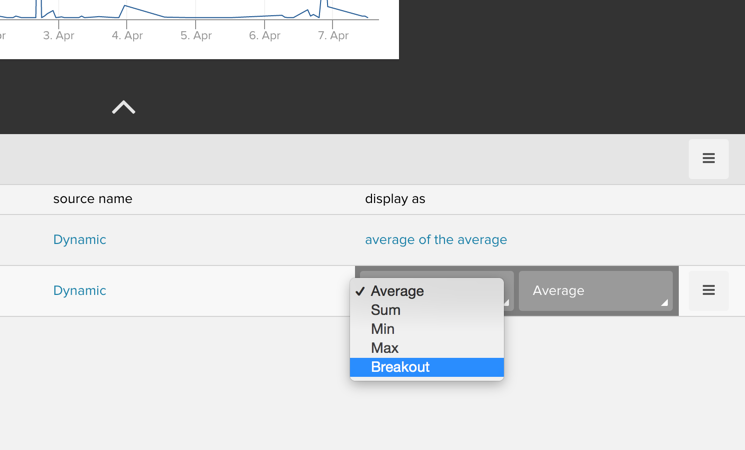
source support. When adding the metric to a chart, specify your source
using an * character to match multiple sources, and then use stream
composition menu (display as) to define how the data is aggregated
over time and across the sources.
Example Use Cases
That’s all well and good, but what do these features mean for your data? Here’s a set of broad characterizations around the types of metrics you might be tracking in gauges and how you should accordingly configure these options.
Timings
A timing is a metric that tracks on average (or percentile) how long it takes to perform a given task e.g. process an application request or process a background job. As we summarize across time and source our primary interest is still the characteristics of a single measurement. Therefore you should leave summarization on the default of average and also combine wildcard sources with average for metrics with these characteristics.
Counts
A count is a metric that tracks how many times an event has occurred, e.g. jobs processed. While we have native support for absolute counters in our counter metric type, you may be counting something where you only know an incremental count at a given time. As we summarize across time and source our primary interest is the absolute total number of events. Therefore you should change summarization to sum and combine wildcard sources with sum for metrics with these characteristics.
Rates
A rate is a metric that tracks how many times an event occurs in a given period of time e.g. requests/minute or jobs processed/minute. As we summarize across time, we want to preserve the unit of time the rate is measured over, while as we summarize over sources we’re interested in the rate our set of sources are achieving in aggregate. Therefore, to summarize a rate you should set summarization to average and combine wildcard sources with sum.
You can calculate a rate over any interval other than a minute with a little more configuration. To begin with you ideally should always report rates that align with the reporting interval. In other words if you submit a measurement every 30 seconds, it should represent a 30 second rate. Likewise if you report a measurement every 17 seconds, it should represent a 17 second rate.
Once you are reporting an aligned rate, first change the metric’s
summarization to sum and then use the
display transform
to calculate any rate you want. The display transform is a linear
function that is run on every measurement prior to rendering it on the
screen. There are two variables you can use in a display transform,
x (the current measurement value) and p (the number of seconds in
the current resolution). So setting a display transform of x/p
will always display a 1 second rate. To calculate any higher rate,
simply multiply p by the given interval. For example, to
calculate a 10 second rate use a display transform of: x/p*10